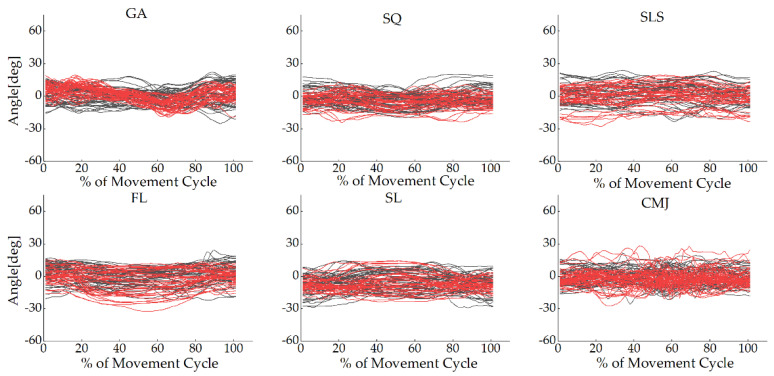
Figure A2.
Hip joint angles in the transverse plane for each participant in all tasks during the movement cycle of the gait (GA), squat (SQ), single-leg squat (SLS), side lunge (SL), forward lunge (FL), and counter-movement jump (CMJ). The black lines represent the OptiTrack system, while the red lines represent the Perception Neuron® system. The Y-axis depicts joint angles in degrees, while the X-axis depicts the movement cycle in %.

