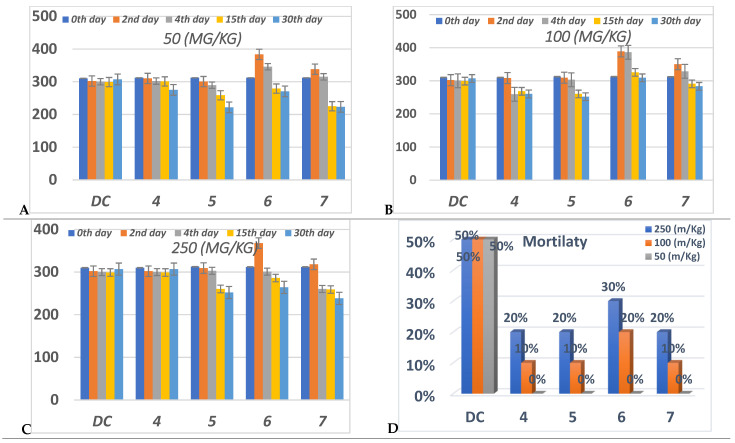
Figure 6.
Anti-diabetic effect in three different concentrations, (A) 50 (mg/Kg), (B) 100 (mg/Kg) (C) 250 (mg/Kg), and (D) percent of mortality after 30 daysfor each group of compounds (4–7) in comparison to diabetic control “DC”. Data analyzed by one way ANOVA followed by LSD test and expressed as mean ± SEM from different observations.

