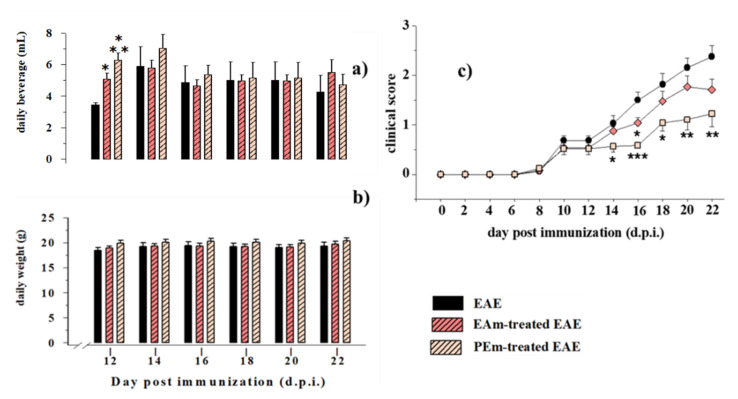
Figure 2.
Effects of “in vivo” EAm and PEm treatments on daily beverage intake, weight and clinical score of EAE mice. (a) Daily beverage intake (mL) in untreated (n = 8 mice), EAm-treated (n = 12 mice) and PEm-treated (n = 12) EAE mice. The daily intake is expressed as mean ± SEM of the drinking solution (mL) taken up. (b) Animal weight (g) in untreated, EAm-treated and PEm-treated EAE mice (number of mice for each group as above). The values are expressed as mean ± SEM of the animal weight (g). (c) Clinical scores of untreated, EAm-treated and PEm-treated EAE mice. PEm and EAm treatment started at 10 d.p.i. (see arrow). The clinical score is evaluated as indicated in the Method section, and it is expressed as mean ± SEM (number of mice for group as above). All of these values were measured every two days, at the indicated day, post-immunization (d.p.i.). Note: * p < 0.05 vs. untreated EAE mice, ** p < 0.01 vs. untreated EAE mice and *** p < 0.001 vs. untreated EAE mice.

