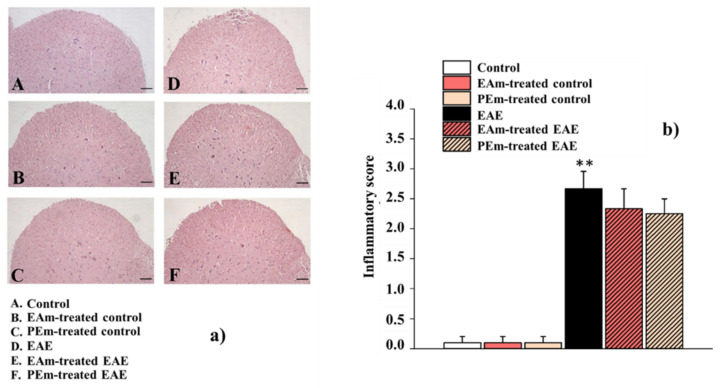
Figure 4.
Effects of “in vivo” EAm and PEm treatments on inflammation in the spinal cord of EAE mice. (a) Representative images of ventral spinal cord marked by Hematoxylin and Eosin staining (total magnification: 100×. Scale bar: 100 µm) and quantitative evaluation of inflammatory infiltrate. The values represent the mean ± SEM of 4 animals per group. (b) Quantitative evaluation of inflammatory infiltrate. The values represent the mean ± SEM of 4 animals per group. Note: ** p < 0.01 vs. control.

