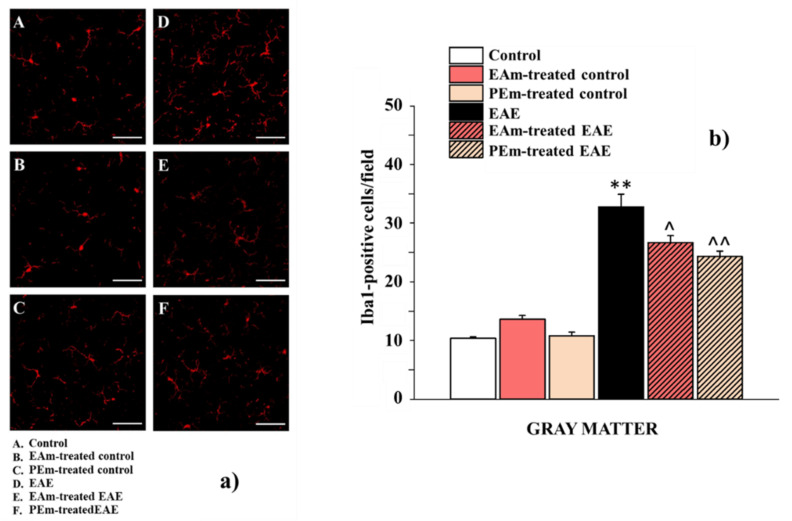
Figure 5.
Effects of “in vivo” EAm and PEm treatments on the microglial profile in the spinal cord. (a) Representative images obtained by Iba-1 immunofluorescence histochemistry of the ventral spinal cord, lumbar portion (total magnification, 400×; scale bar, 50 µm). (b) Quantitative analysis for Iba-1positive cells/field in the ventral gray matter. Results are expressed as mean ± SEM of n = 4 animals per group. Note: ** p < 0.01 vs. control group; ^ p < 0.05 or ^^ p < 0.01 vs. EAE group.

