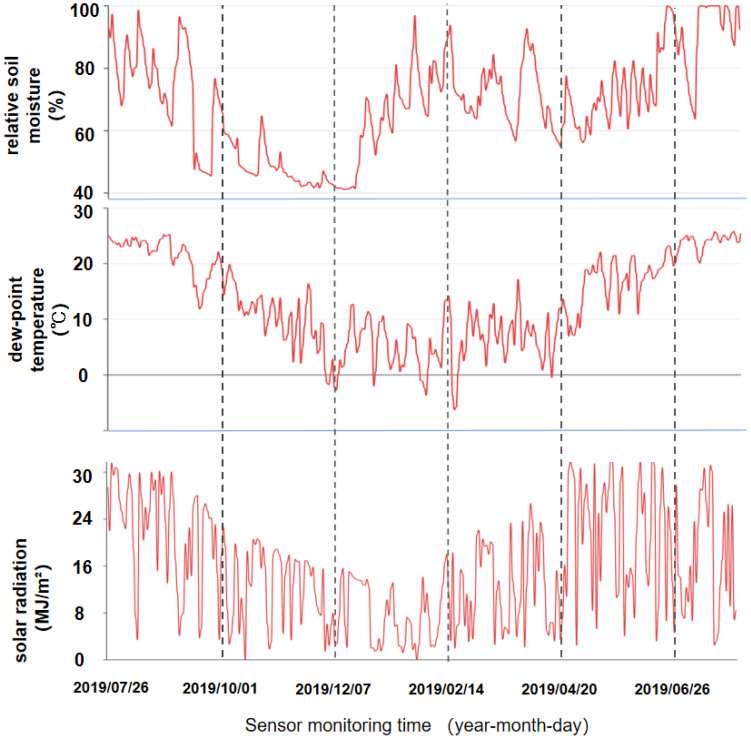
Figure 4.
The slope was monitored for one year with meteorological data that could not be found in the Hangzhou station atmospheric data. Each image represents a single meteorological unit of monitoring data. From top to bottom are the relative soil moisture, dew point temperature and solar radiation intensity.

