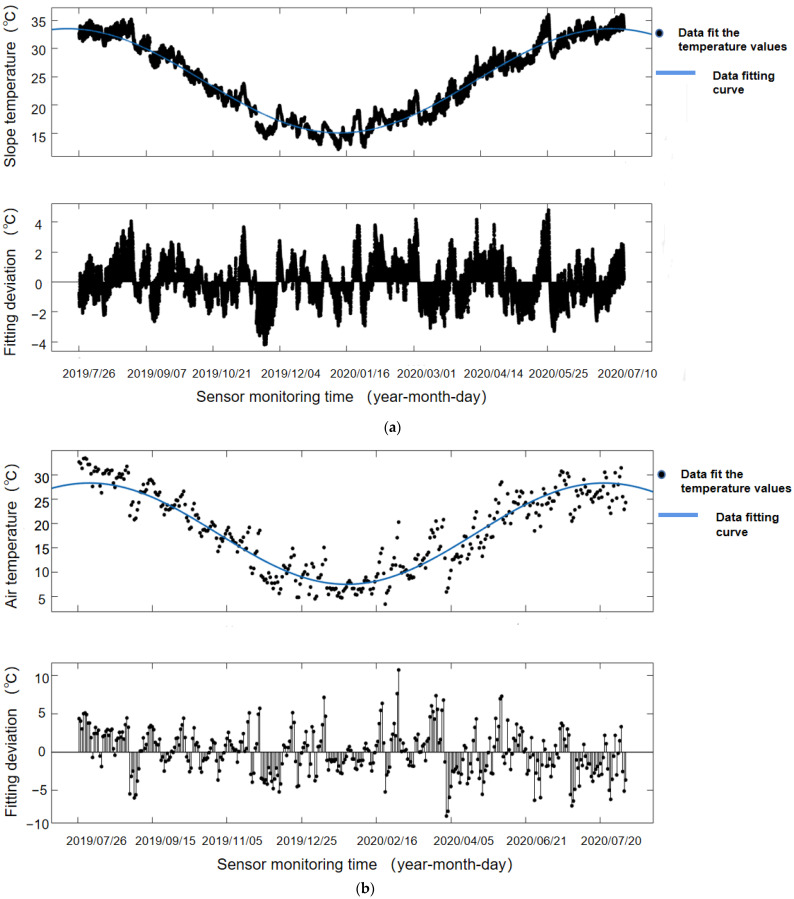
Figure 6.
The data-fitting system of cloud platform server is used to fit the slope micrometeorological temperature monitoring data and atmospheric temperature data, in which the blue curve represents the Fourier function fitting curve, and the black represents each data point. (a) Fitting curve and fitting deviation of slope micrometeorological temperature monitoring data; (b) Fitting curve and fitting deviation of atmospheric temperature monitoring data.

