Figure 6.
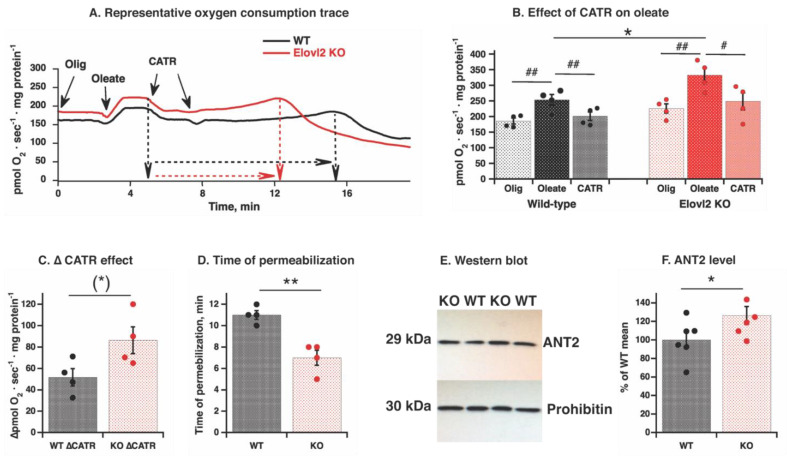
ANT2 protein level and CATR effect on fatty acid-induced uncoupling in wild-type and Elovl2 KO mitochondria: (A) Representative oxygen consumption traces showing effects of 60 µM oleate and 2 µM CATR in liver mitochondria. The mitochondria were incubated as in Figure 5 (A) with BSA and malate and glutamate, then with 3 μg/mL oligomycin (Olig), and oleate was added as a single 60 µM dose to induce detectable respiration; then treated with 1 μM carboxyatractyloside (CATR) twice as indicated by arrows. Dashed black (WT) and red (KO) arrows indicated different time durations for development of permeabilization-like phenomena. (B) Compilation of experiments performed as in A. The individual values are displayed in bars with means ± SEM from 4 independent mitochondrial preparations of each genotype. Significant differences are shown between WT and Elovl2 KO mice, * p ˂ 0.05 and between oleate-induced respiration and other respiratory states (oligomycin-insensitive and CATR-inhibited), # p < 0.05 and ## p < 0.01. (C) CATR effect was estimated as ∆ between rate of oleate-stimulated and CATR-inhibited rate. The individual values are displayed in bars with means ± SEM from 4 independent mitochondrial preparations of each genotype. (*) indicates p = 0.06 (almost reaching significance between WT and Elovl2 KO mice). (D) Time to permeabilization after CATR addition. The time period between adding the first dose of CATR and the spontaneously developed peak of oxygen consumption was measured in minutes for each mitochondrial preparation as shown in (A), and the individual values are displayed in bars with means ± SEM from 4 independent mitochondrial preparations of each genotype are presented by bars. Significant differences are shown between WT and Elovl2 KO mice, ** p ˂ 0.01. (E) Representative western blot of ANT2 protein from WT and Elovl2 KO liver mitochondria. Prohibitin is used as a loading control. In all cases, 20 µg of mitochondrial protein were loaded per lane. (F) Quantification of western blot analysis. As a standard control, a mix of all the samples was loaded at least twice on each gel and used as a reference to calculate the amount of protein. These raw values were used for statistical analysis. For graphical presentation, normalization was performed: mean of WT values was taken as 100%, and all other values are expressed relative to this 100%. The individual values are displayed in bars with means ± SEM from 6 independent mitochondrial preparations of each genotype. Significant differences are shown between WT and Elovl2 KO mice, * p ˂ 0.05.

