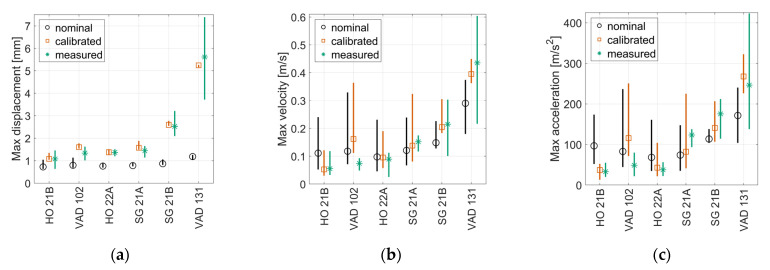
Figure 21.
Comparison between maximum measured and simulated sleeper responses (mean value marker, full range vertical line) for (a) displacement, (b) velocity, and (c) acceleration. Simulated results with either nominal (o-black) or calibrated track model parameters (□-orange); train speed 160 km/h for HO 21B, SG 21A, and SG 21B; 190 km/h for HO 22A, VAD 102; and 130 km/h for VAD 131; and 19 different wheel profiles. Measured results from 20 signals (*-green) recorded at similar train speeds as in the simulations. Data are low-pass-filtered at 250 Hz.

