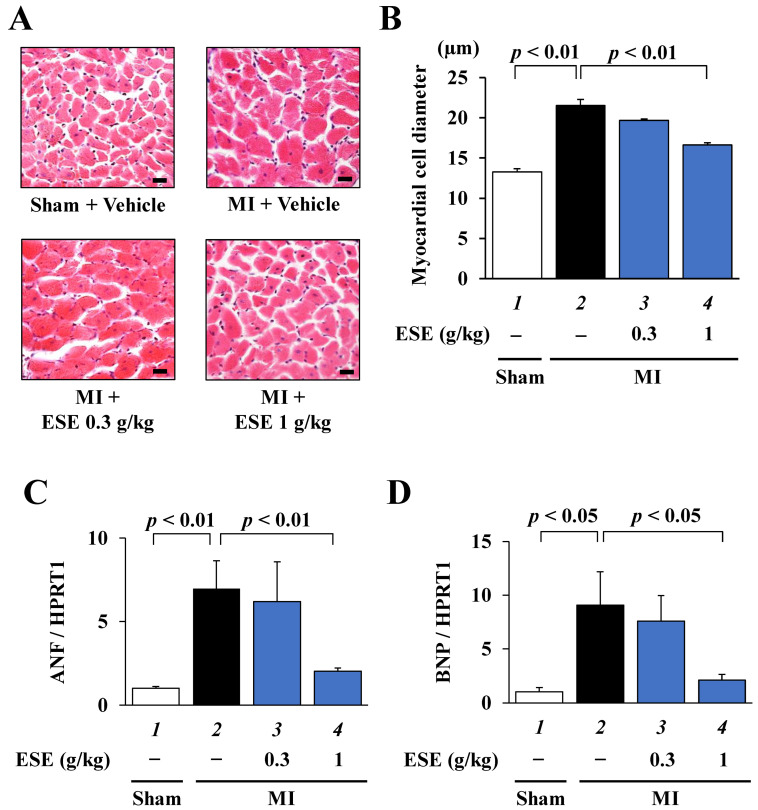
Figure 4.
Cardiac hypertrophy was suppressed by ESE treatment in rats with MI. (A) Representative images of HE-stained sections of cardiomyocytes from sham and MI rats. Magnification: ×400. Scale bar: 20 μm. (B) Myocardial cell diameter was measured for at least 50 cells in each rat. Data are presented as the mean ± SEM. (C,D) Quantitative RT-PCR data for (C) ANF, (D) BNP, and HPRT1. Data are presented as the mean ± SEM.

