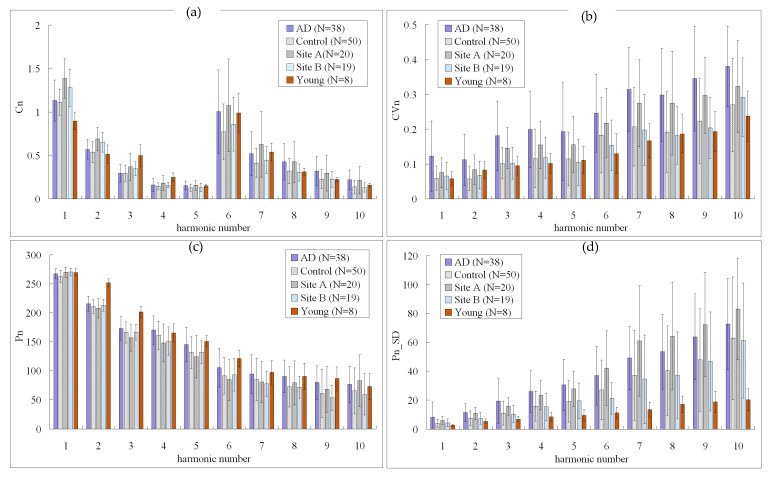
Figure 3.
Comparisons of BPW harmonic indices of AD patients, control, community (Sites A and B), and young subjects: (a) Cn, (b) CVn, (c) Pn, and (d) Pn_SD. Data are mean and standard-deviation values. C6–C10 values have been multiplied by 10 to make the differences clearer. p values are listed in Table 3.

