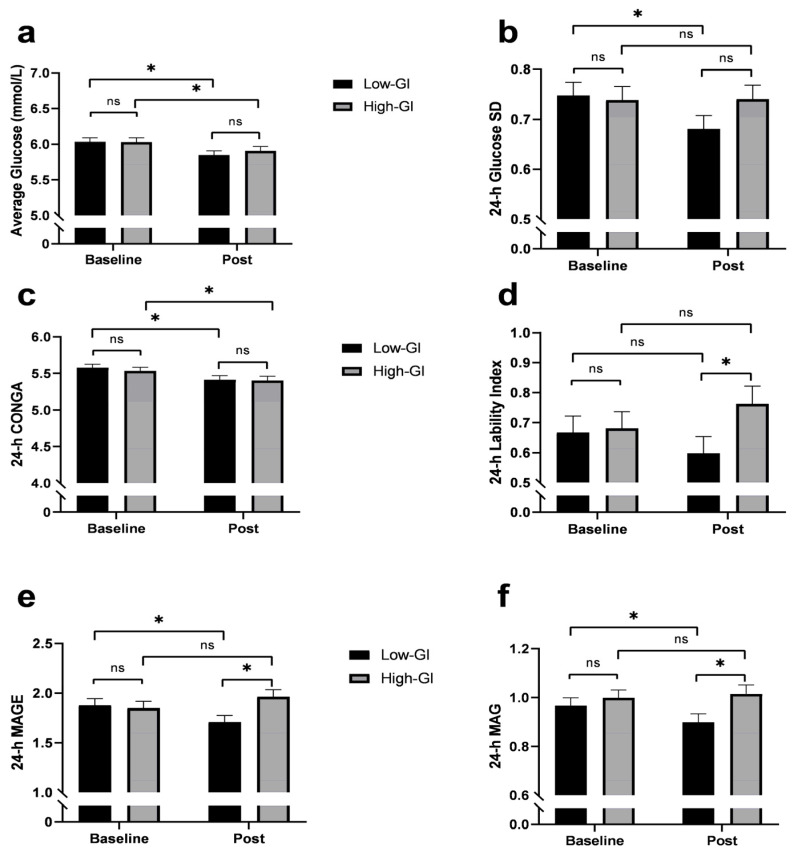
Figure 3.
24-h continuous glucose monitor-derived measures of glycemic variability at baseline and after a 12-week dietary intervention. (a) Average 24-h glucose concentration, (b) standard deviation (SD), (c) continuous overall net glycemic action (CONGA), (d) lability index, (e) mean amplitude of glucose excursions (MAGE), and (f) mean absolute glucose (MAG). Presented data are means ± SEM. * Statistically significant, p < 0.05. ns, no significance.

