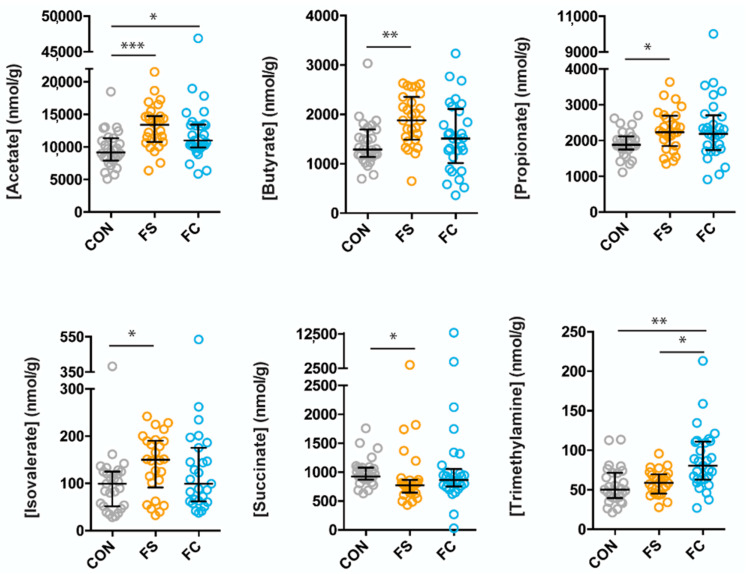
Figure 4.
Cecal metabolite differences due to iron form. Metabolites were analyzed by Kruskal–Wallis with Dunn’s multiple comparisons. All metabolites shown are significant by Kruskal–Wallis. Median, and interquartile range of concentrations are indicated (n = 27–29/group, 3 litters/group). p-value summary: *, p < 0.05; **, p < 0.01; ***, p < 0.001.

