
Fig. 3.
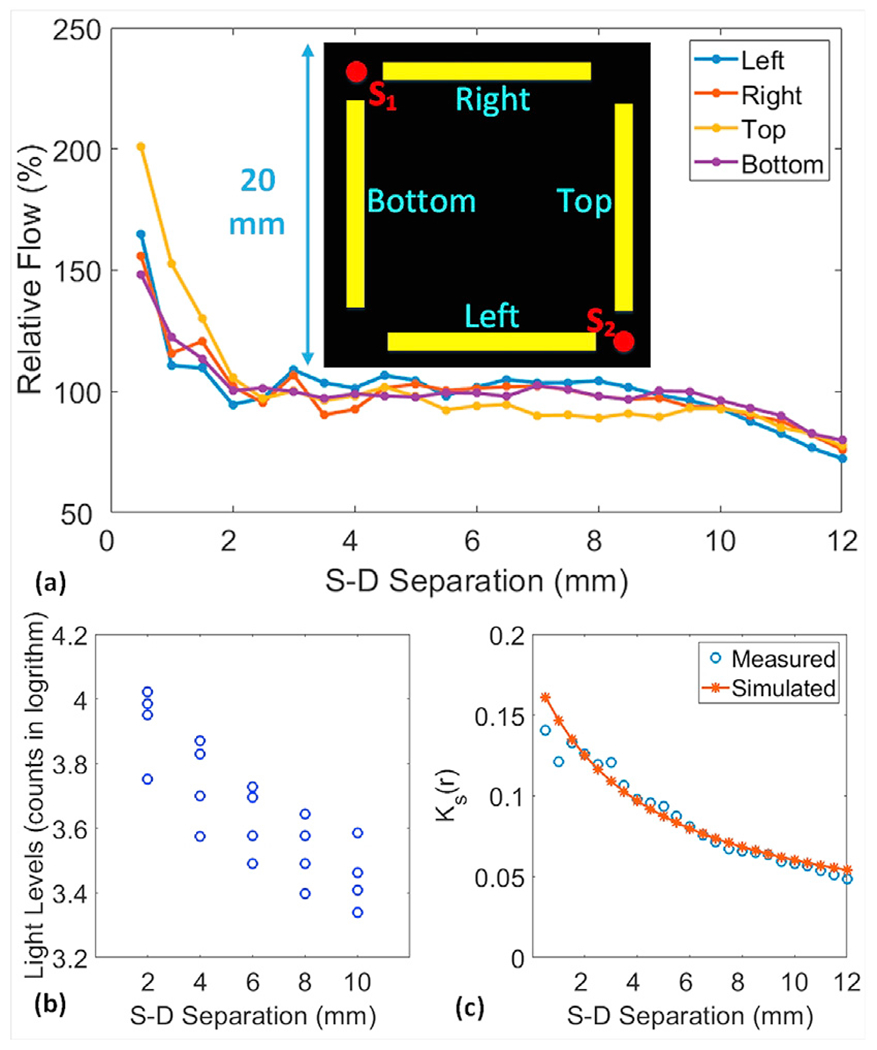
(a) Boundary flow distributions over the selected sources (S1 and S2) and detector arrays. Each detector array consisted of 24 detectors and S-D separations ranged from 0.5 to 12mm with an interval distance of 0.5 mm. Flow indices were normalized to their mean value to generate relative flow values for presentation. (b) Light intensities over the two sources (S1 and S2) and four detector arrays were logarithmically related to S-D separations. (c) Theoretical and measured Ks(r) distributions at different S-D separations across the source S2 and left detector array.