
Fig. 5.
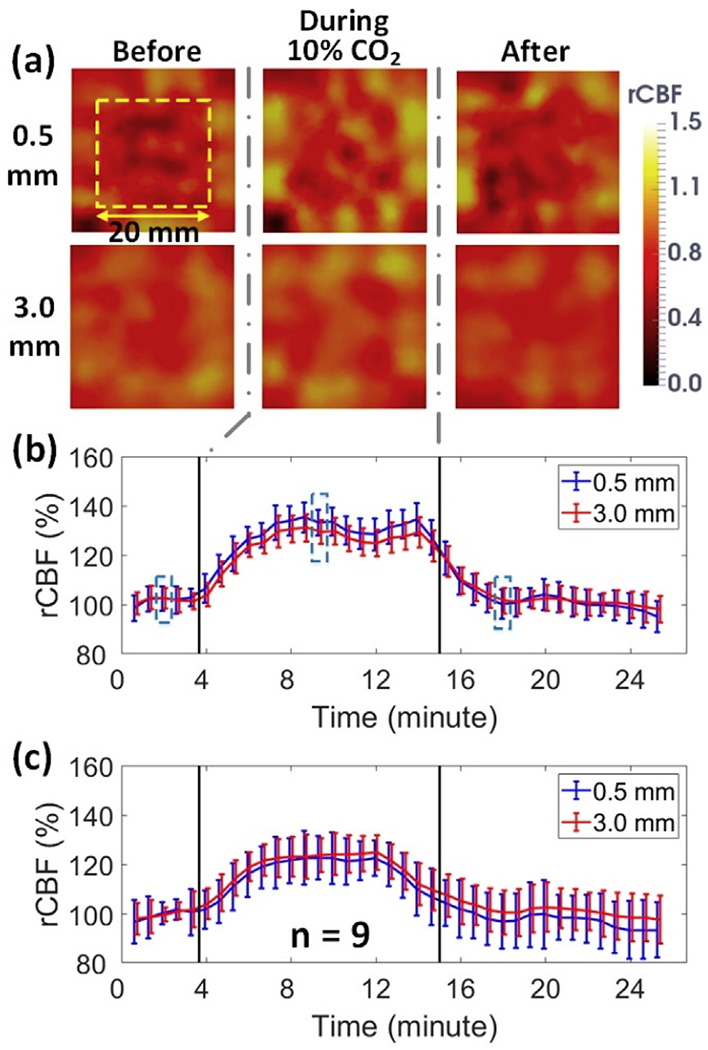
3D imaging of rCBF responses to CO2 inhalation. (a) Cross-sectional views of 3D flow images at the depths of 0.5mm (scalp/skull) and 3.0mm (cerebral cortex) before, during, and after CO2 inhalation in an illustrative rat (Rat #5). (b) Time-course of rCBF changes at two depths from Rat #5. Error bars represent standard deviations of regional rCBF. (c) Average time-course rCBF variations over 9 rats. Error bars represent standard errors of regional rCBF over 9 rats.