
Fig. 6.
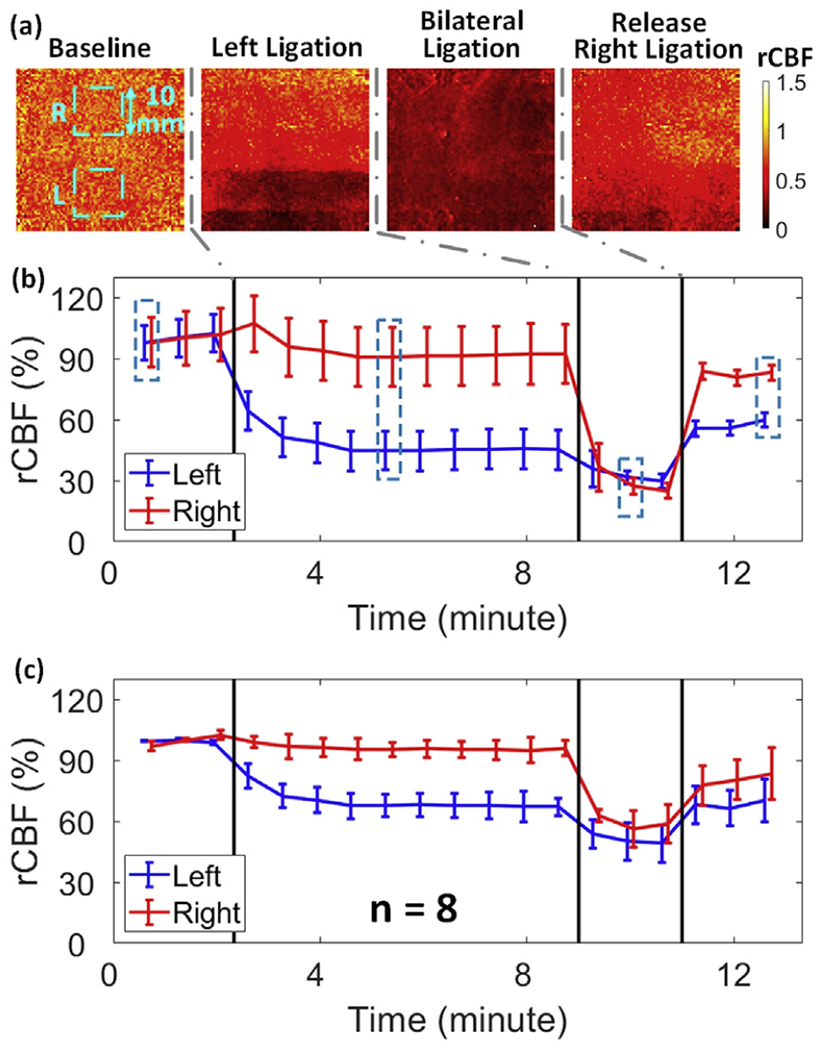
2D mapping of rCBF responses to sequential unilateral and bilateral CCA ligations. (a) 2D rCBF maps before, during, and after unilateral and bilateral ligations in an illustrative rat (Rat #3). The 10 × 10mm2 regions used to average CBF values corresponding to each hemisphere are marked with dashed squares. (b) Time-course of rCBF variations in two hemispheres from Rat #3. Error bars represent standard deviations of regional rCBF. (c) Average time-course of rCBF variations in each hemisphere for 8 rats. Error bars represent standard errors of regional rCBF over 8 rats.