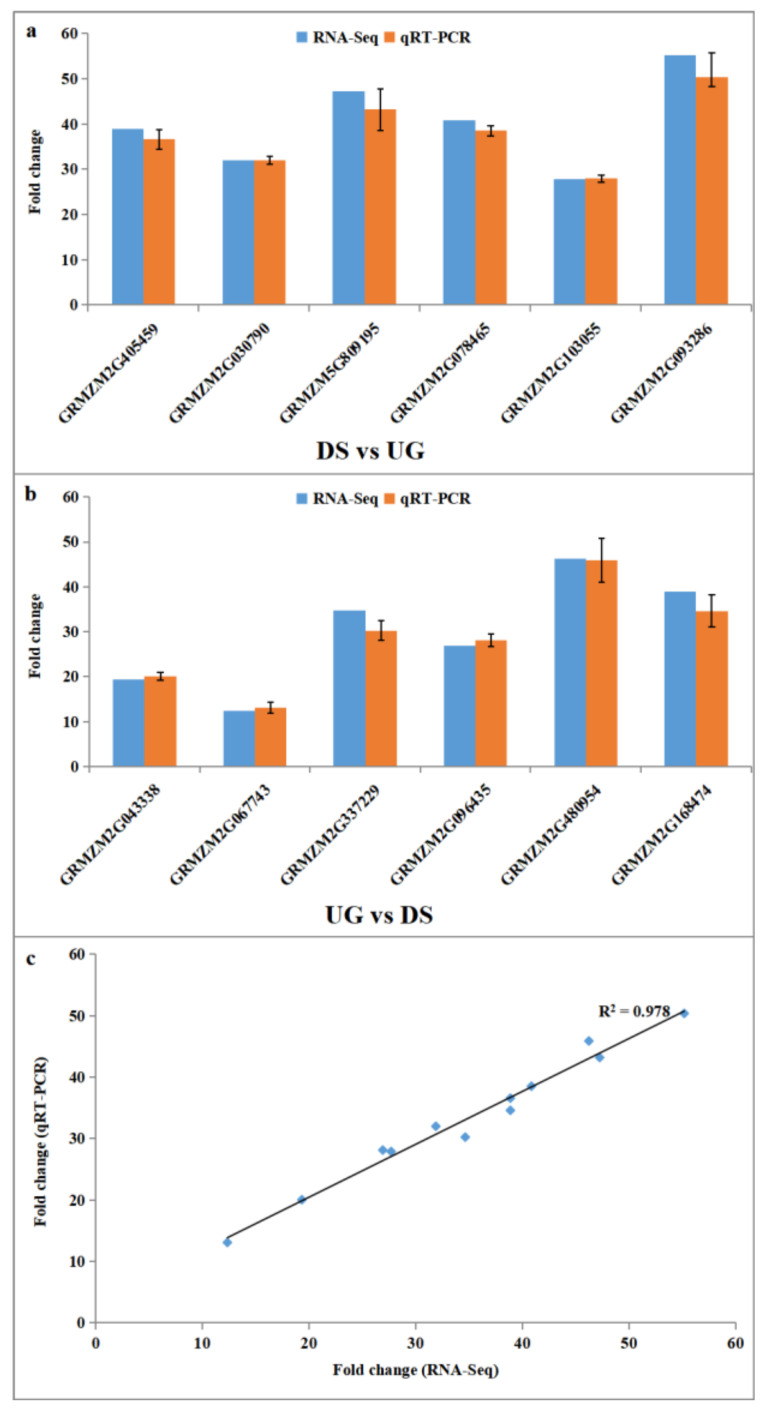
Figure 6.
Real-time quantitative PCR (qRT-PCR) validation of RNA-Seq results. (a,b) Expression of six upregulated DEGs and six downregulated DEGs validated by qRT-PCR and compared with their expression obtained from RNA-Seq. (c) Pearson correlation analysis of gene-expression ratios obtained from qRT-PCR and RNA-Seq data. Error bars indicate standard error of the mean.

