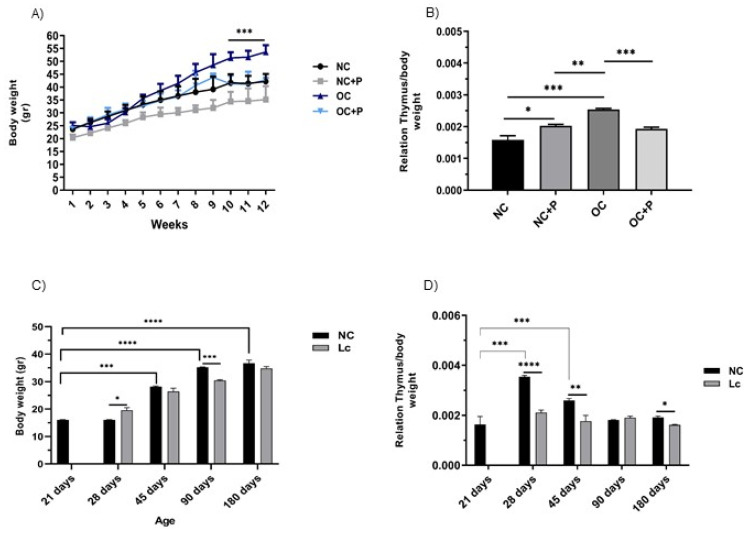
Figure 1.
Body and thymus weight changes in senescence and obesity animal models. Mice were weighed every week during the experience. On the day of sacrifice, the thymus weight of each animal was also registered. Each point represented the average ± SD of the weight data pooled from 3 independent experiments with 3 mice per group. (A) Body weight differences registered in normal control mice (NC); normal control mice that received a conventional diet and supplementation with the probiotic bacteria (CN+P); obese mice (OC), and obese mice that received the HFD and probiotic supplementation (OC+P). (C) Body weight curves of mice at different ages (21, 28, 45, 90 and 180 days of age). The thymus/body weight ratio was calculated by dividing the organ weight by the body weight for (B) the group of obese mice and (D) mice at different ages. One-way ANOVA with Tukey’s correction for multiple comparisons * p < 0.05; ** p < 0.001; *** p < 0.001; **** p < 0.0001.

