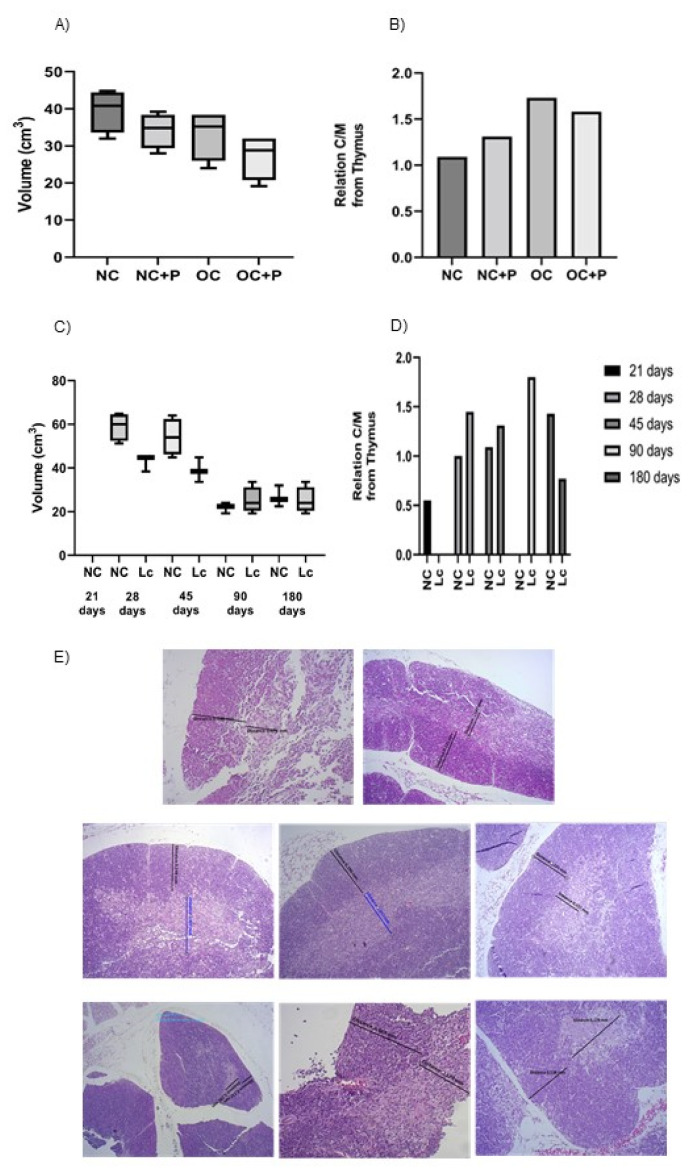
Figure 3.
Post-mortem determination of thymus volume. The organ was extracted and weighed after the sacrifice. Each point represented the average ± SD of volume data pooled from 3 independent experiments with 3 mice per group. (A,C): size of the thymus in the obesity and senescence mouse models, respectively, (B,D): cortex/medullary /relationship from the thymus in obesity and senescence mouse models, respectively. Results (mean ± SD) were representative of three independent experiments. Micrographs of thymus sections in the different animal models. Tissue sections from obese (E) and senescence mouse models stained with hematoxylin and eosin. Magnification 1000×.

