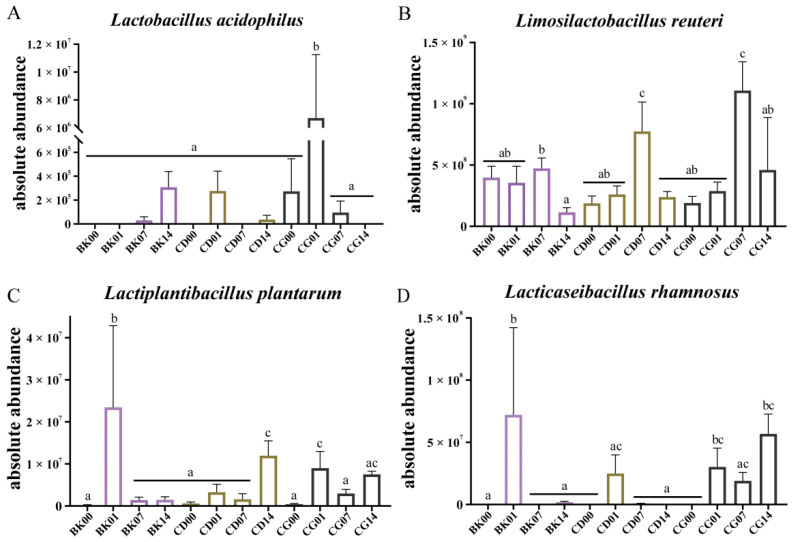
Figure 9.
Absolute abundances of the Lactobacillus species with respect to the effects of probiotic compounds. Probiotic compounds included (A) Lactobacillus acidophilus; (B) Limosilactobacillus reuteri; (C) Lactiplantibacillus plantarum; (D) Lacticaseibacillus rhamnosus. Normal group, BK; low-dose group, CD; high-dose group, CG; the first gavage, 00; the last gavage, 01; one week after stopping gavage, 07; two weeks after stopping gavage, 14. Statistical significance between groups is indicated by a–c: different letters indicate that there is a difference between groups (p < 0.05, ANOVA, Tukey test).

