Figure 2.
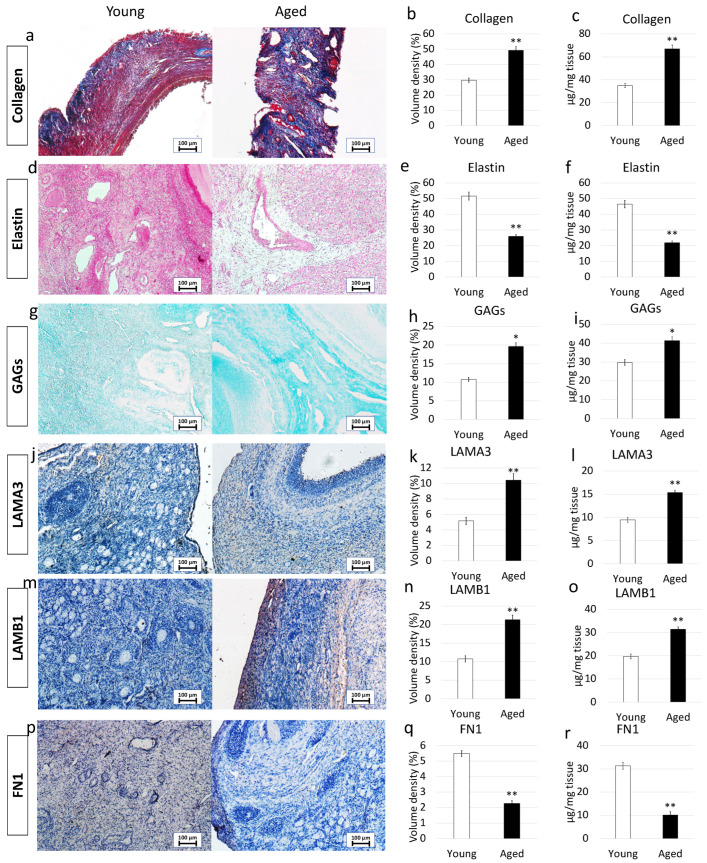
Histochemical and immunohistochemical analysis, stereological quantification, and ELISA tests in young and aged ovaries. (a) Masson’s trichrome staining showed the presence of collagen (blue) and elastic (magenta) fibers in both young and aged ovaries. Scale bars = 100 μm; (b) Stereological analysis demonstrated a significant increase of collagen fibers in aged ovaries compared to the young ones. Data are expressed as the mean. Error bars represent the standard error of the mean (SEM), ** p < 0.01; (c) ELISA quantifications indicated a significant increase of the collagen content in aged ovaries compared to the young ones. Data are expressed as the mean. Error bars represent the standard error of the mean (SEM), ** p < 0.01; (d) Gomori’s Aldehyde Fuchsin staining revealed the presence of elastic fibers in both young and aged ovaries. Scale bars = 100 μm; (e) Stereological analysis displayed a significant decrease of elastic fibers in aged ovaries compared to the young ones. Data are expressed as the mean. Error bars represent the standard error of the mean (SEM), ** p < 0.01; (f) ELISA quantifications confirmed a significant decrease of the elastin content in aged ovaries compared to the young ones. Data are expressed as the mean. Error bars represent the standard error of the mean (SEM), ** p < 0.01; (g) Alcian blue staining showed the presence of GAGs in both young and aged ovaries. Scale bars = 100 μm; (h) Stereological analysis indicated a significant increase of GAGs in aged ovaries compared to the young ones. Data are expressed as the mean. Error bars represent the standard error of the mean (SEM), * p < 0.05; (i) ELISA quantifications confirmed a significant increase of the GAG content in aged ovaries compared to the young ones. Data are expressed as the mean. Error bars represent the standard error of the mean (SEM), * p < 0.05; (j) Immunohistochemical staining of young and aged ovaries for LAMA3. Scale bars = 100 μm; (k) Stereological analysis demonstrated a significant increase of LAMA3 in aged ovaries compared to the young ones. Data are expressed as the mean. Error bars represent the standard error of the mean (SEM), ** p < 0.01; (l) ELISA quantifications showed a significant increase of the LAMA3 content in aged ovaries compared to the young ones. Data are expressed as the mean. Error bars represent the standard error of the mean (SEM), ** p < 0.01; (m) Immunohistochemical staining of young and aged ovaries for LAMB1. Scale bars = 100 μm; (n) Stereological analysis revealed a significant increase of LAMB1 in aged ovaries compared to the young ones. Data are expressed as the mean. Error bars represent the standard error of the mean (SEM), ** p < 0.01; (o) ELISA quantifications displayed a significant increase of the LAMB1 content in aged ovaries compared to the young ones. Data are expressed as the mean. Error bars represent the standard error of the mean (SEM), ** p < 0.01; (p) Immunohistochemical staining of young and aged ovaries for FN1. Scale bars = 100 μm; (q) Stereological analysis indicated a significant decrease in FN1 content in aged ovaries compared to the young ones. Data are expressed as the mean. Error bars represent the standard error of the mean (SEM), ** p < 0.01; (r) ELISA quantifications showed a significant increase of the LAMB1 content in aged ovaries compared to the young ones. Data are expressed as the mean. Error bars represent the standard error of the mean (SEM), ** p < 0.01.

