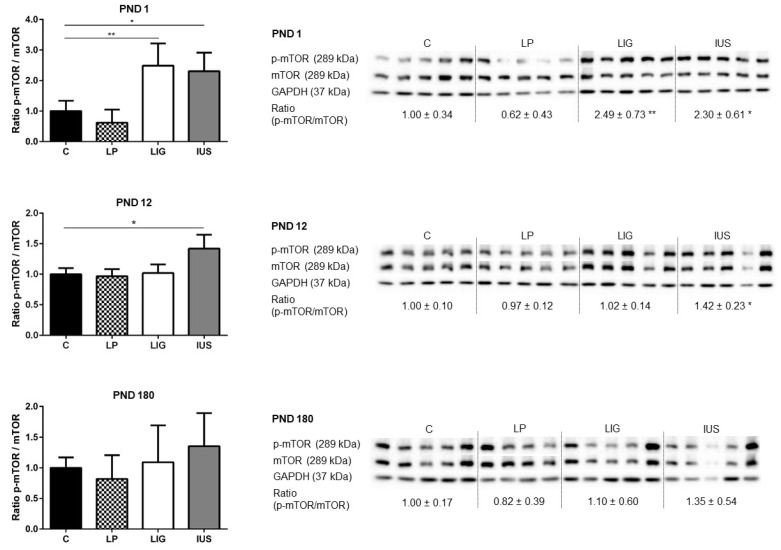
Figure 4.
Western blot analyses of phospho-mTOR (p-mTOR, Ser2448) and mTOR proteins in the hippocampus of male rats on postnatal days PND 1, PND 12 (C, n = 5; LP, n = 5; LIG, n = 5; IUS, n = 5) and PND 180 (C, n = 5; LP, n = 4; LIG, n = 5; IUS, n = 5). Glyceraldehyde 3-phosphate dehydrogenase (GAPDH) was used as additional reference protein for quality assurance but not used for calculations. Densitometric ratios were calculated for p-mTOR/mTOR and are shown for each group (C, controls; LP, low protein; LIG, ligation; IUS, intrauterine stress) as mean ± SD directly below the appropriate Western blot signals. Data were compared by nonparametric one-way ANOVA. Dunn’s post-test was performed for the comparisons LP—C, LIG—C, IUS—C. Asterisks indicate significance; *, adjusted p < 0.05; **, adjusted p < 0.01. The ratio of p-mTOR/mTOR was significantly increased in LIG offspring on PND 1, as well as in IUS offspring on PND 1 and PND 12.

