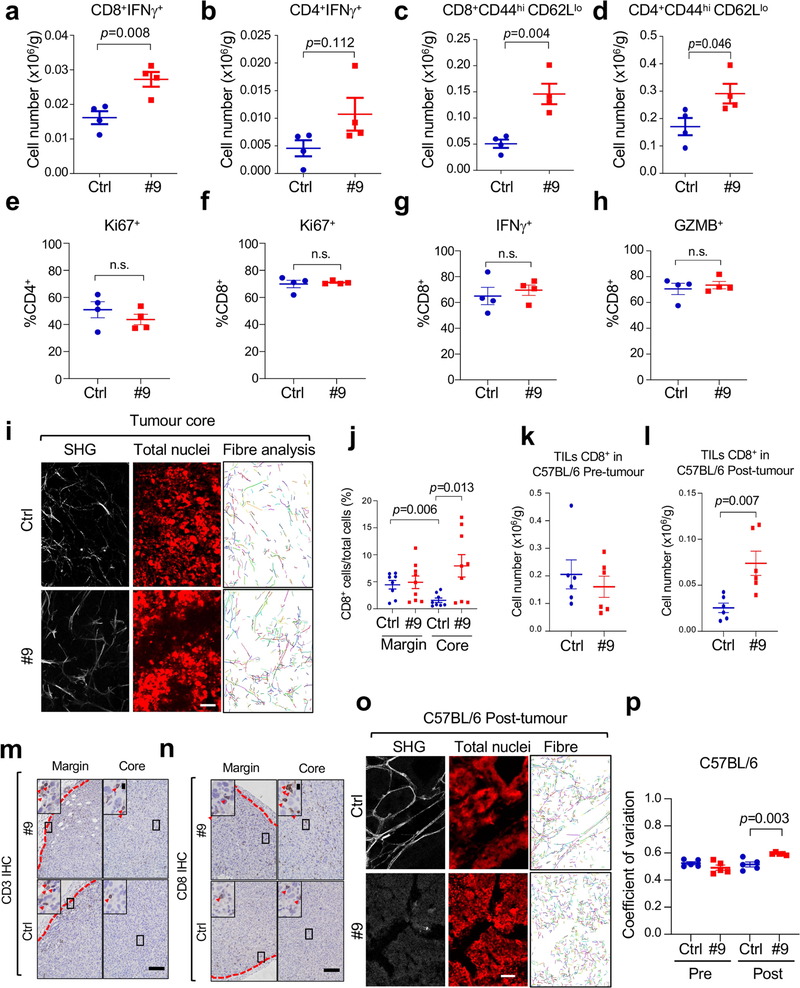
Extended Data Fig. 9 |. DDR1 antibody boosts the infiltration of anti-tumour immune cells.
(a–d) Indicated TIL numbers normalized by tumour weight in E0771 KO+huDDR1 tumours from C57BL/6 mice treated with control and anti-DDR1 antibody #9 (n = 4 tumours/group). (e–h) Percentage of Ki67-positive cells in CD4+, CD8+ T cells and percentage of IFNγ- or GZMB-positive cells in CD8+ T cells from the same antibody-treated mice as in (a–d) (n = 4 tumours/group). n.s. not significant. (i) Representative images of transplanted mammary tumours treated with Ctrl or anti-DDR1 #9 antibody, analysed by SHG, To-pro-3 staining, and collagen fibre individualization. Scale bar: 50 μm. (j) Quantification of CD8+ T cells in tumour margin and core in control and anti-DDR1 antibody-treated E0771 KO+huDDR1 tumours (Ctrl: n = 8 tumours, #9: n = 9 tumours). (k, l) TILs from spontaneous mammary tumours (C57B/6) treated with Ctrl or anti-DDR1 #9 antibody under the pre-tumour (k) and post-tumour (l) conditions. n = 6 tumours/group. (m, n) Representative IHC images of CD3+ and CD8+ T cells in tumour margin and core in control and anti-DDR1 antibody-treated E0771 KO+huDDR1 tumours. Tumour boarder denoted by red dash lines. Box areas at higher magnification are shown in the inlets. Red arrow heads indicate CD8+ cells. Scale bar: 100 μm and 10 μm in inlet. (o) Representative images of tumours from the post-tumour treatment group, analysed by SHG, To-pro-3 staining, and collagen fibre individualization. Scale bar: 50 μm. (p) Quantification of tumour fibre alignment in pre- and post-tumour treatment in C57BL/6 hosts (n = 5 tumours/group). Values represent mean ± SEM. p value as indicated, two-tailed Student’s t-test.

