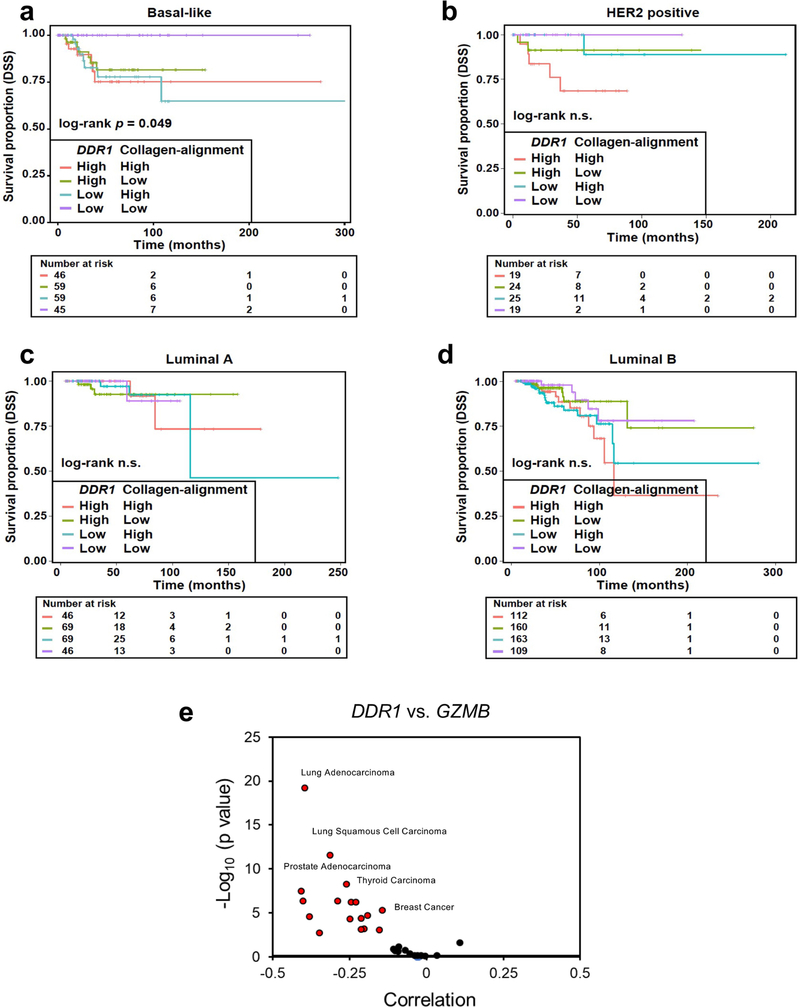
Extended Data Fig. 10 |. DDR1-related clinical correlation in cancers.
(a–d) Kaplan–Meier curves showing disease specific survival (DSS) rates for TCGA patients with breast cancer divided by major tumour subtypes: basal-like (a), HER2 positive (b), luminal A (c), and luminal B (d). Each subtype is further divided in four patient groups according to the tumour expression levels of the DDR1 gene and collagen-alignment signature. The gene/signature classification in high and low expression was based on their corresponding average expression values. The log-rank test p value and the number of individuals at risk at different follow-up times are shown in each tumour subtype analysis. (e) Correlation between human DDR1 and GZMB mRNA expression in various cancer types.

