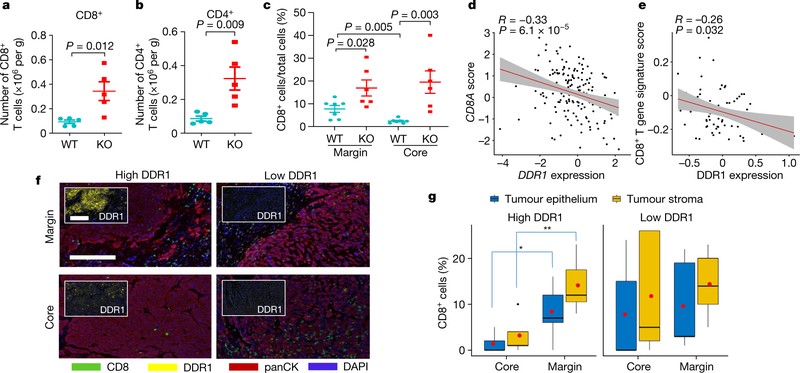
Fig. 2 |. DDR1 inhibits the infiltration of anti-tumour immune cells.
a, b, Abundance of CD8+ (a) and CD4+ (b) T cells normalized by E0771 tumour weight per gram (WT, n = 5 tumours; KO, n = 5 tumours). c, Quantification of CD8+ T cells by IHC in E0771 tumour margin and core (WT, n = 7 tumours; KO, n = 6 tumours). The y axis is the percentage of CD8+ cells over total cells in a given field. d, Scatter plots showing the negative gene expression (z-score) correlation between DDR1 mRNA levels and CD8A. Spearman’s correlation coefficients and P values are shown. e, Scatter plots showing the negative expression correlation between the expression of DDR1 protein and CD8+ T gene signature scores in CPTAC BRCA (see ‘Bioinformatics analysis’ in Methods). f, Multiplex immunofluorescent staining of DDR1, CD8 and tumour-specific panCK using DDR1high (n = 7) and DDR1low (n = 5) TNBC tumour samples. Scale bar, 200 μm. g, Quantification of CD8+ cells in tumour core and margin of DDR1high and DDR1low samples from f. CD8+ cell populations were divided into those contained within tumour epithelium and stromal compartments. The CD8+ cell percentage was CD8+ cell number over total cell number in a given field per slide. The bounds of the box represent the 25th and 75th percentiles of the interquartile range. The black line in the box interior represents the median of the data. The red dot represents the mean of the data. The whiskers represent the minimum and maximum values of the data and the black dot outside the box and whiskers represents an outlier. *P < 0.05, **P < 0.01. Values represent mean ± s.e.m.; two-tailed Student’s t-test.

