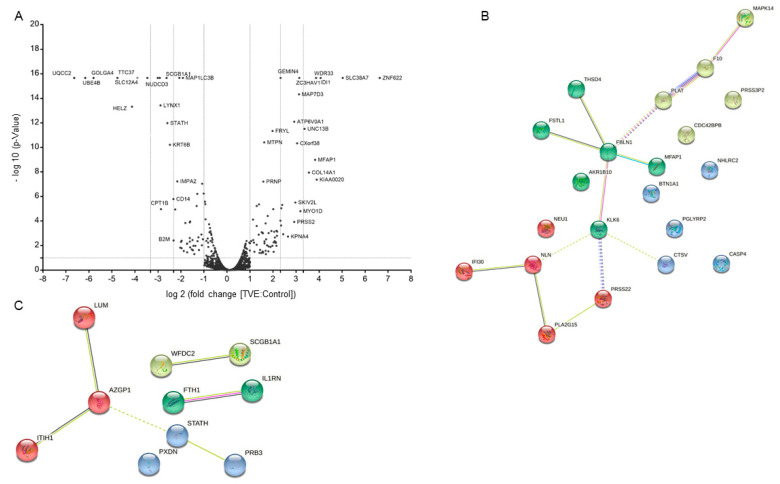
Figure 4.
(A) Volcano plot of significance vs. fold change of TVE vs. control proteins. STRING analysis of TVE more abundant (B) and less abundant (C) proteins annotated as being extracellular ones by PD. The four clusters are shown in different colors. Each protein is labeled through its gene name.

