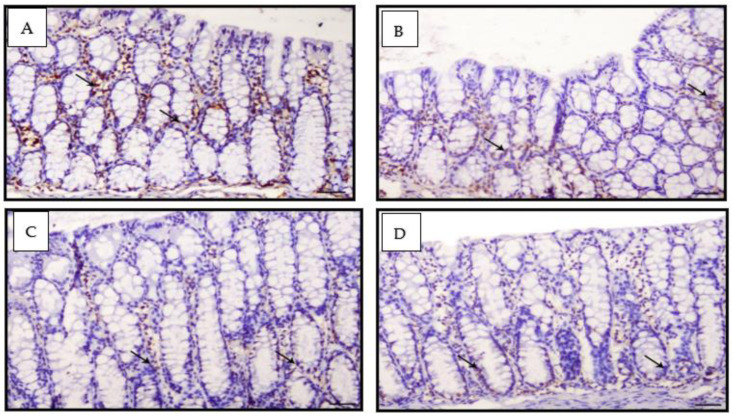
Figure 9.
Photomicrographs of colon sections of mice stained IHC with PCNA; (A): Colon section of Group I animals showing mild expression of PCNA within the intestinal crypts (arrows), PCNA IHC, ×200, bar = 50 μm; (B,C): Colon section from Group II animals showing mild expression of PCNA within the intestinal crypts (arrows), PCNA IH, ×200, bar = 50 μm; (D) Colon section from Group III animals showing mild expression of PCNA within the intestinal crypts (arrows), PCNA IHC, ×200, bar = 50 μm.

