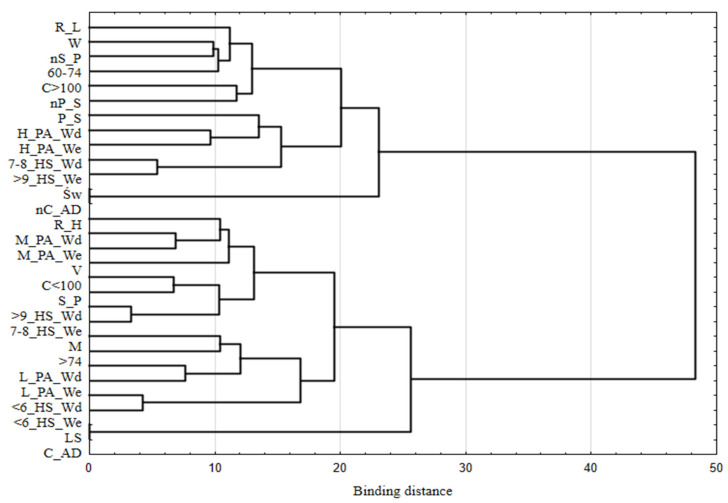
Figure 1.
Hierarchical classification of variables describing nutritional risk, based on selected demographic and lifestyle features. R_L—low nutritional risk; R_H—high nutritional risk; W—woman; M—man; 60–74—age in years; >75—age 75 and over; C > 100—city with over 100,000 inhabitants; C < 100—city with up to 100,000 inhabitants; V—village; Św—Świętokrzyskie voivodeship; LS—Lower Silesia voivodeship; C_AD—consumption of alcoholic drinks; nC_AD—no consumption of alcoholic drinks; S_P—smoking in the present; nS_P—no smoking in the present; P_S—past smoking; nP_S—no past smoking; <6_HS_Wd—six hours of sleep or less on weeknights; 7–8_HS_Wd—seven or eight hours of sleep on weeknights; >9_HS_Wd—nine hours of sleep or more on weeknights; <6_HS_We—six hours of sleep or less at weekends; 7–8_HS_We—seven or eight hours of sleep at weekends; >9_HS_We—nine hours of sleep or more at weekends; L_PA_Wd—low physical activity on weekdays; M_PA_Wd—medium physical activity on weekdays; H_PA_Wd—high physical activity on weekdays; L_PA_We—low physical activity at weekends; M_PA_We—medium physical activity at weekends; H_PA_We—high physical activity at weekends.

