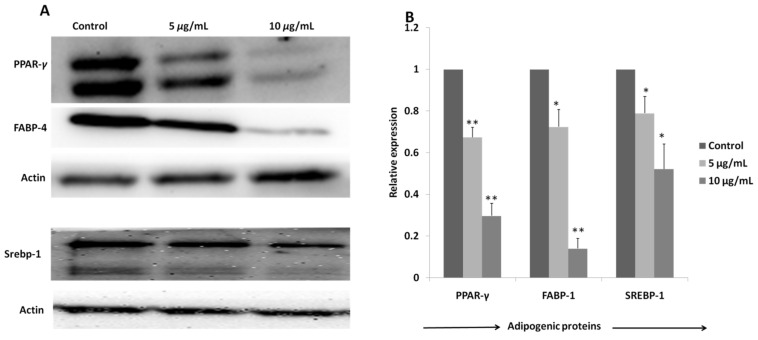
Figure 7.
(A)Expression of PPAR-γ, FABP-4, SREBP-1 and actin proteins in 3T3-L1 cells on treatment with different doses of oxypeucedanin measured by Western blot analysis. (B) Densitometry analysis was performed to quantify protein levels and results were presented as mean of (n = 3) ± standard deviation. Significant difference between the groups was calculated using two-tailed Student’s t-test. * p ˂ 0.05 vs. control, ** p ˂ 0.01 vs. control are used to represent significant difference in expression of adipogenic proteins in treated group compared to non-treated control group.

