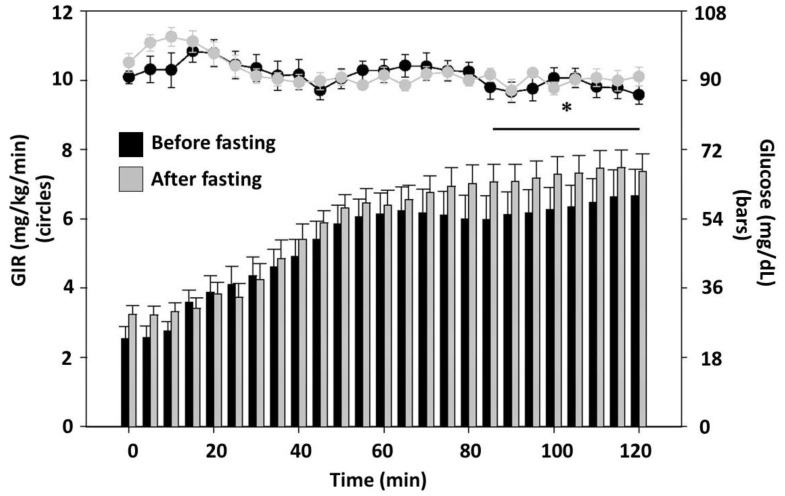
Figure 2.
Glucose infusion rate (GIR) and glucose level during hyperinsulinemic clamp before and after 20 days of intermittent fasting. Participants were eight healthy males who had a hyperinsulinemic clamp performed before and after 20 days of alternating-day fasting for 20 h. Left axis (bars) shows the glucose infusion rate (GIR) necessary to maintain euglycemia during both clamps. Right axis (dots) shows the plasma glucose concentrations. Black bars and dots represent data from the clamp before the fasting intervention; gray bars and dots are data from after the fasting intervention. Following fasting, the insulin-mediated glucose update increased from 6.3 ± 0.6 to 7.3 ± 0.3 mg/kg/min. * p < 0.05 for comparing after fasting values to before fasting values. From Halberg et al. J Appl Phys 2005: 99(6):2128–2136; used by permission [35].

