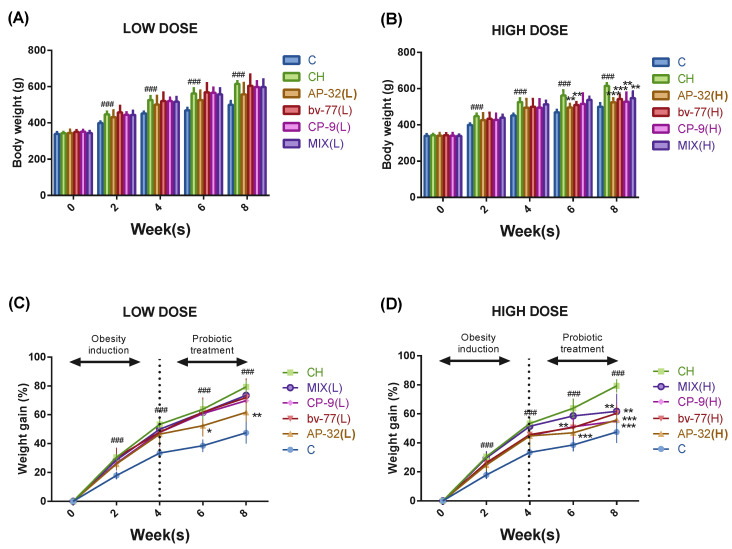
Figure 1.
Body weights and weight gain rates in obese rats from week 0 to week 8. Sprague-Dawley (SD) rats were fed a high-fat diet to induce obese symptoms for 8 weeks. The probiotic groups were treated with a single strain (AP-32, bv-77, or CP-9) or a mixture of 3 strains (MIX) at a low (L = 5 × 10⁹ CFU/kg/day) or high (H = 2.5 × 10¹⁰ CFU/kg/day) dosage. The group of rats fed a normal diet was the blank control (C), and the one fed a high-fat diet was the symptom control (CH). The bar graph represents the body weights of rats treated with a (A) low dose and (B) high dose of a probiotic strain(s). The weight gain rate was normalized to the body weight at week 0, and presented as a percentage in rats treated with a (C) low dose and (D) high dose of a probiotic strain(s). The body weight was recorded every 2 weeks, and data show the mean ± S.D. of six animals in each group. The dotted line represents the beginning of the probiotic supplementation. Statistical analysis was performed by using a one-way ANOVA. Statistical difference was compared between the C and CH groups (### p < 0.005) or between the CH and a probiotics-treated group (* p < 0.05, ** p < 0.01, and *** p < 0.005).

