Figure 5.
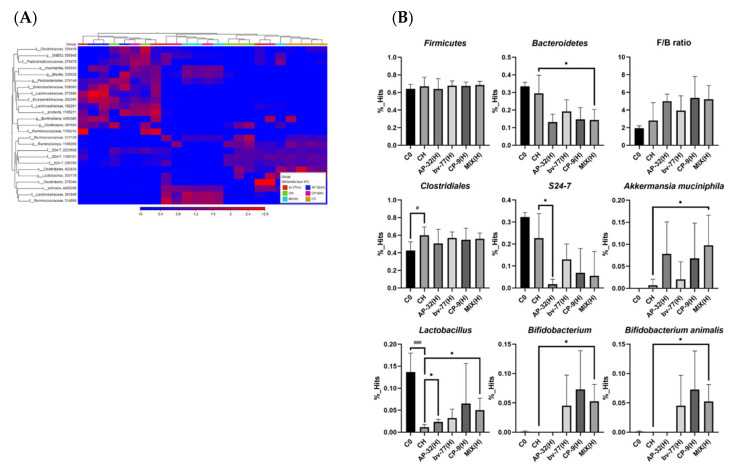
Core gut microbiota were altered by 8-week probiotic treatments. Core microbiota were determined by the heatmap analysis based on the operational taxonomic unit (OTU) tables. (A) Rows represent the 25 bacterial genera that were significantly enriched either in the control or probiotic-treated rats. Columns represent the 24 samples of the control and probiotic-treated rats. (B) Bar graphs showing relative abundance changes in core microbiota from the heatmap biplot analysis. F/B ratio: Firmicutes-to-Bacteroides ratio. Data show the mean ± SD of each group. Statistical analyses were performed by using the Student’s t-test. Statistical difference was shown as a comparison between the C0 and CH groups (# p < 0.05 and ### p < 0.001) or the CH and probiotic groups (* p < 0.05). C0: blank control; C: control; CH: symptom control; MIX: probiotic mixture of AP-32, bv-77, and CP-9; H = 2.5 × 10¹⁰ CFU/kg/day.

