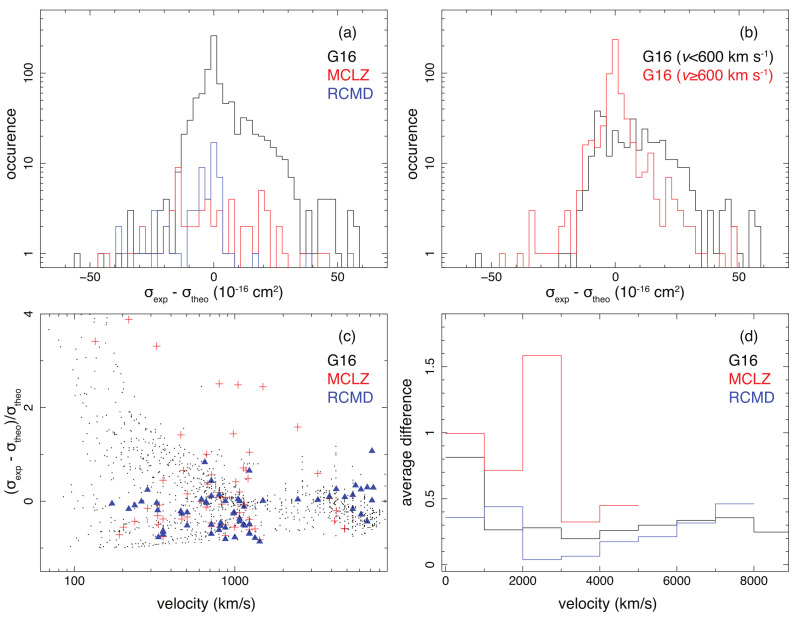
Figure 2.
Distributions of the absolute (upper) and relative (lower) deviations of the theoretical cross sections from the experimental results obtained with the measurements summarized in Table 1. (a) Diagrams of the absolute errors for the G16 (black), MCLZ (red), and RCMD (blue) theories. (b) Diagrams of the absolute errors for G16 for low-collision velocities (black) and high velocities (red). (c) The relative deviations for the G16 (black points), MCLZ (red crosses), and RCMD (blue triangles) calculations. (d) The average deviations in absolute values for the three methods in each velocity interval.

