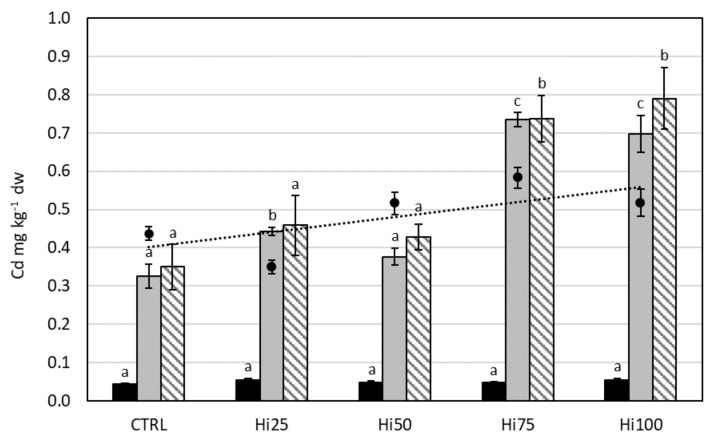
Figure 1.
Cadmium content (mg kg−1 dw) in diets (dark spot, dashed trend line) and in larvae (black bars), juveniles (gray bars), and adults (striped bars) of Danio rerio fed with experimental diets: CTRL, control; Hi25, Hi50, Hi75, and Hi100, diets enriched with 25, 50, 75, and 100% of Hi full-fat prepupae, respectively. The values are presented as mean ± standard deviation (n = 3). Different letters indicate statistically significant differences between specimens of the same life stage (p < 0.05).

