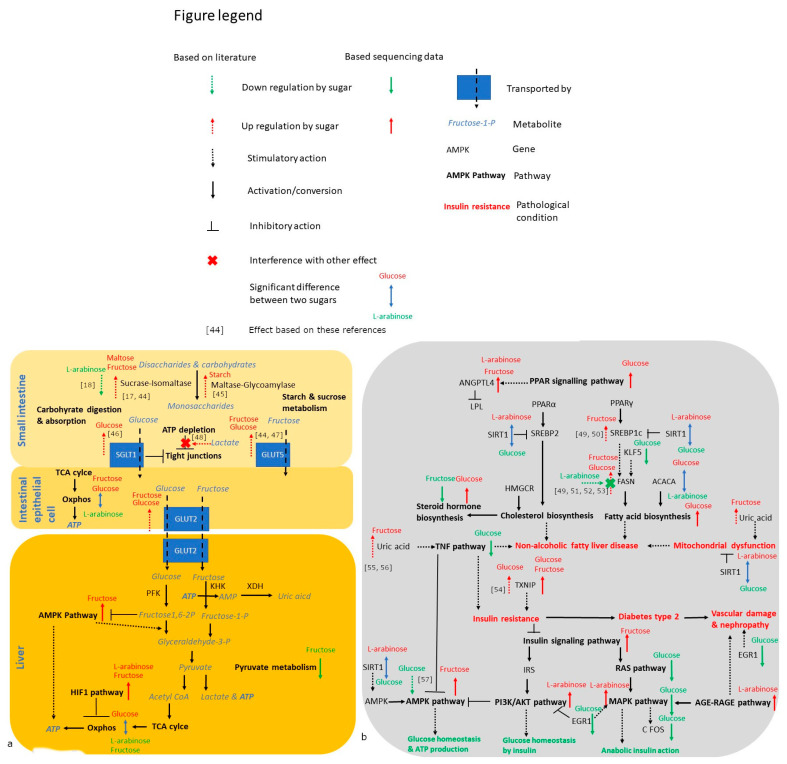
Figure 6.
Pathway figure showing how energy metabolism (a) and metabolic health (b) are affected by 55 mM glucose, fructose and l-arabinose (5 well-replicates spread over 3–5 independent plates per condition). Bold arrows next to a gene or pathway indicate that they are significantly (p < 0.05 following corrections for multiple comparison) impacted by 24-h sugar exposure: green (downregulation compared to mannitol), red (upregulation compared to mannitol) or blue (significantly higher for the sugar stated above versus below the arrow) [17,18,44,45,46,47,48,49,50,51,52,53,54,55,56,57].

