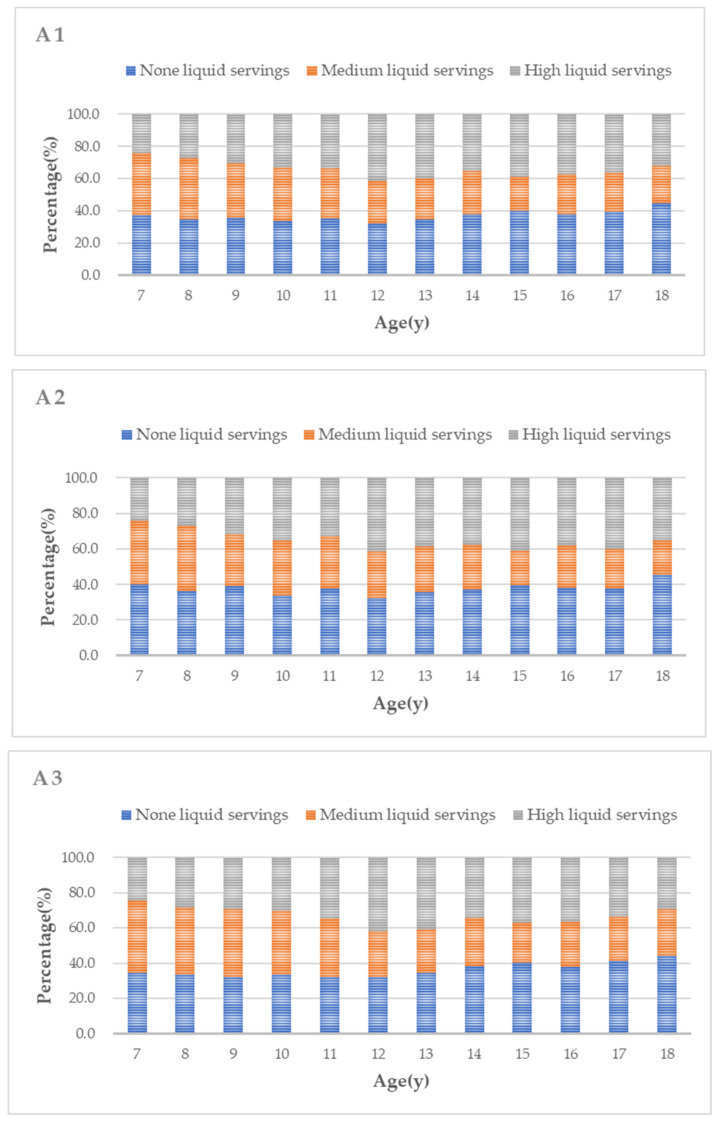
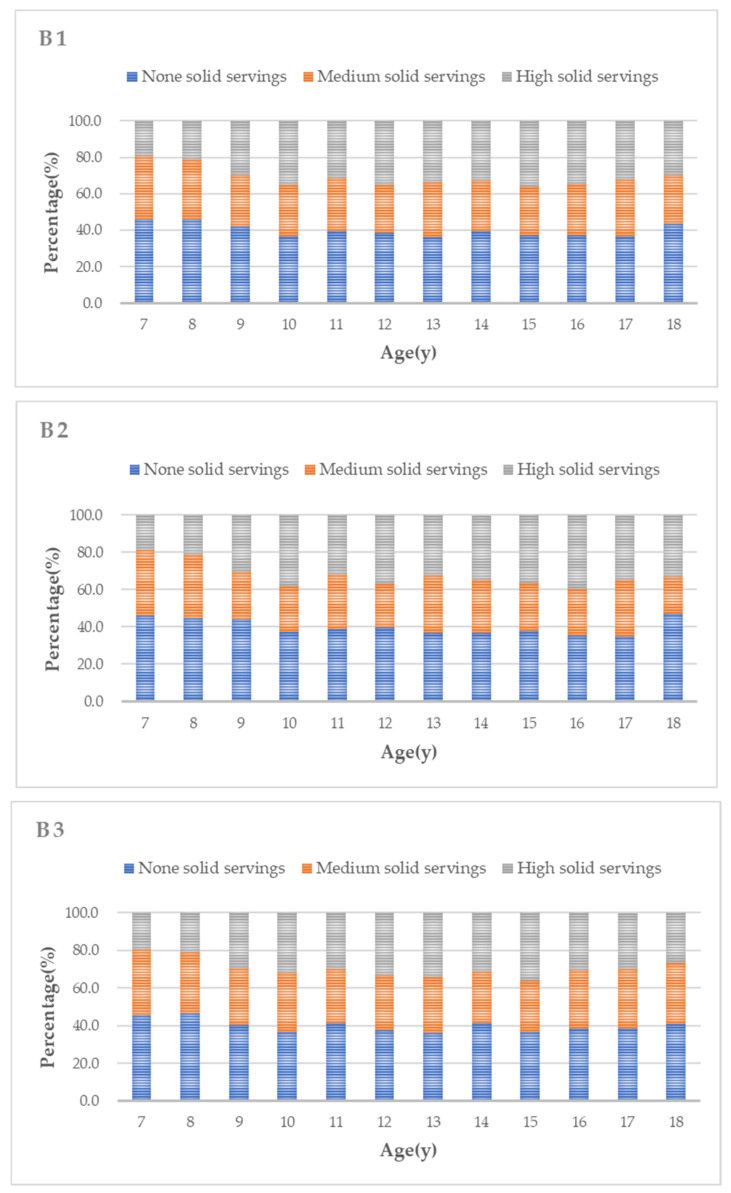
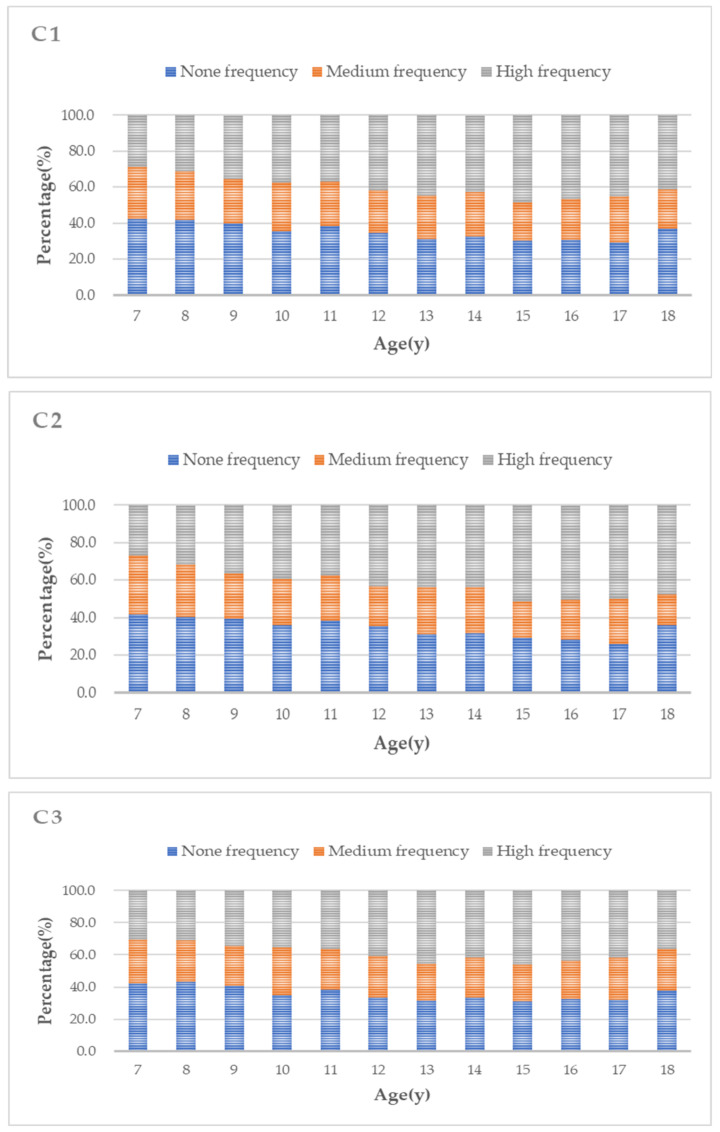
Figure 1.
Soy food intake in Chinese children and adolescents according to age 1 for total, 2 for males and 3 for females; (A1–A3) present data on liquid soy food; (B1–B3) present data on solid soy food; (C1–C3) present data on the intake frequency of all soy food. (A1,B1,C1) show data for the total population; (A2,B2,C2) show data for the boys; (A3,B3,C3) show data for the girls.


