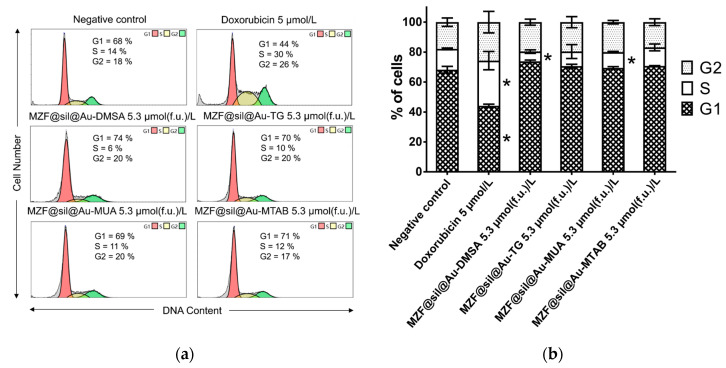
Figure 8.
Analysis of the cell cycle of MCF-7 cells 48 h after the application of suspensions of gold nanoshells functionalized with DMSA, TG, MUA, and MTAB with a ferrite concentration of 5.3 µmol(f.u.) L−1: (a) Representative histograms with the mean percentage of cells cycling through phases G1, S, and G2 from flow cytometry of three separate treatments; (b) the bar graph summarizing the percentage of cells in each phase of the cell cycle. Data are presented as mean values ± SD from three experiments; the asterisk marks the results significantly different (p ≤ 0.05) from the negative control that was treated with sterile deionized water. Cells treated with 5 µM doxorubicin were used as a positive control.

