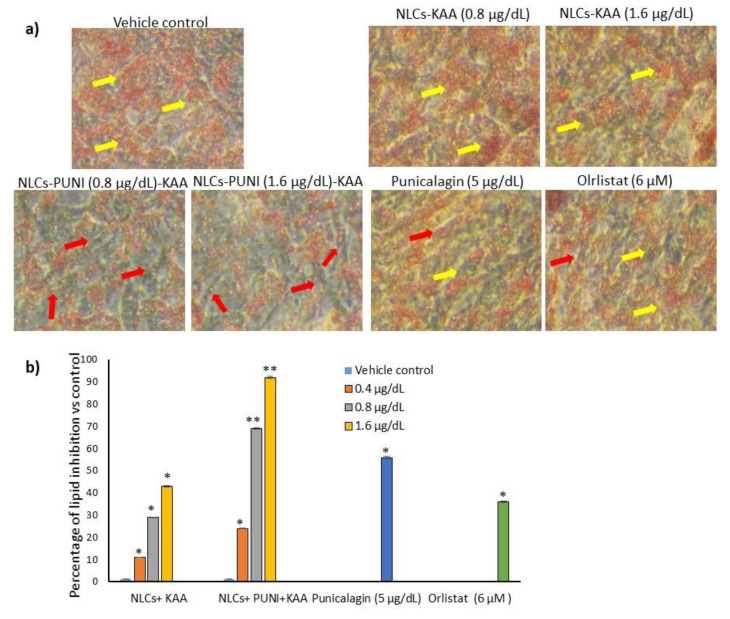
Figure 3.
Oil Red O stained light microscopic image (a) of vehicle control, NLCs-KAA, NLCs-PUNI-KAA, PUNI and orlistat treated maturing adipocyte after 14 days. The quantity of Oil Red O stain in each group (b) directly resembles the lipid accumulation level. Each of the values are means ± SD (n = 6). ** p ≤ 0.001 and * p ≤ 0.05 compared with vehicle control. In Oil Red O staining, vehicle control showing hypertrophic adipocyte (yellow arrow heads) directly propositional to excessive triglyceride storage. However, in NLCs-PUNI-KAA treatment found with less lipid accumulation and linear adipocytes morphology (red arrow heads). NLCs-PUNI-KAA treated cells showing highest inhibition of lipid accumulation compared to NLCs-KAA or PUNI or orlistat.

