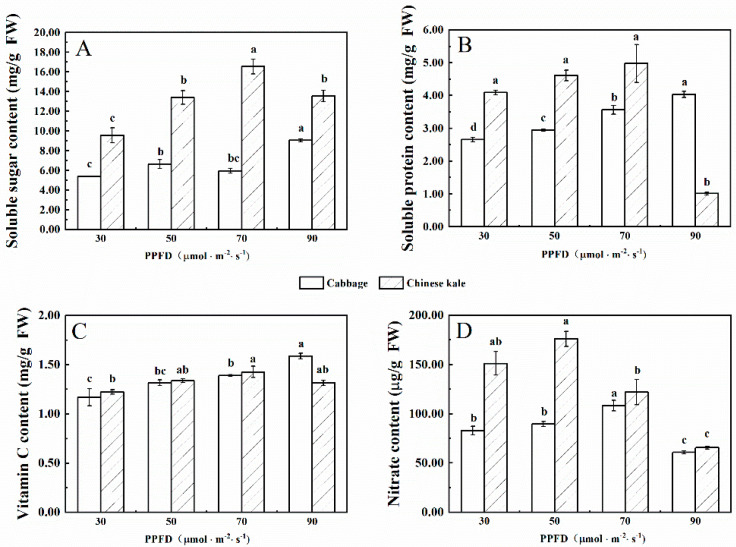
Figure 1.
The contents of soluble sugar (A), soluble protein (B), vitamin C (C) and nitrate (D) in cabbage and Chinese kale microgreens under different light intensities treatments. Different letters (a–d) on the bar plots indicate significant difference at p < 0.05 using one-way analysis of variance with Duncan’s multiple-range test.

