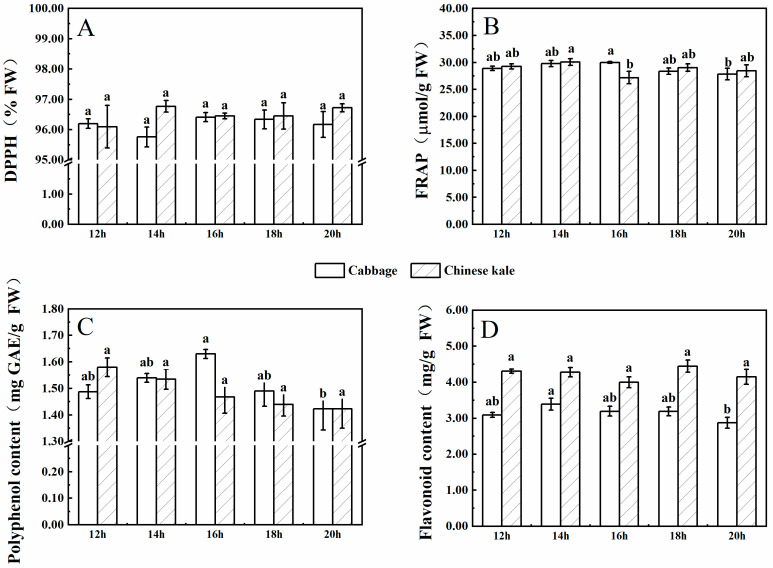
Figure 8.
The contents of DPPH (A), FRAP (B), polyphenol (C), and flavonoid (D) in cabbage and Chinese kale microgreens under different photoperiod treatments. Different letters (a,b) on the bar plots indicate significant difference at p < 0.05 using one-way analysis of variance with Duncan’s multiple-range test.

