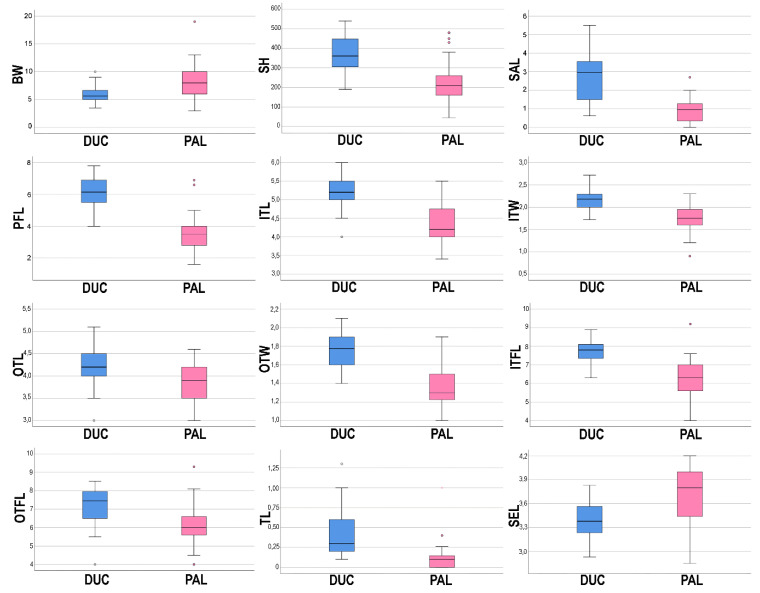
Figure 8.
Boxplots expressing morphological variation between Allium ducissae (DUC) and A. palentinum (PAL): bulb width (BW), stem height (SH), spathe appendage length (SAL), pedicel flower length (PFL), inner tepal length (ITL), inner tepal width (ITW), outer tepal length (OTL), outer tepal width (OTW), inner filament length (ITFL), outer filament length (OTFL), tooth of inner filament length (IFTL), seed length (SEL). Outlined central box depicts middle 50% of data, extending from 25th and 75th percentiles, and horizontal bar is the median. Ends of vertical lines (or “whiskers”) indicate minimum and maximum data values, unless outliers are present, in which case whiskers extend to a maximum of 1.5 times inter-quartile range. Circles indicate outliers.

