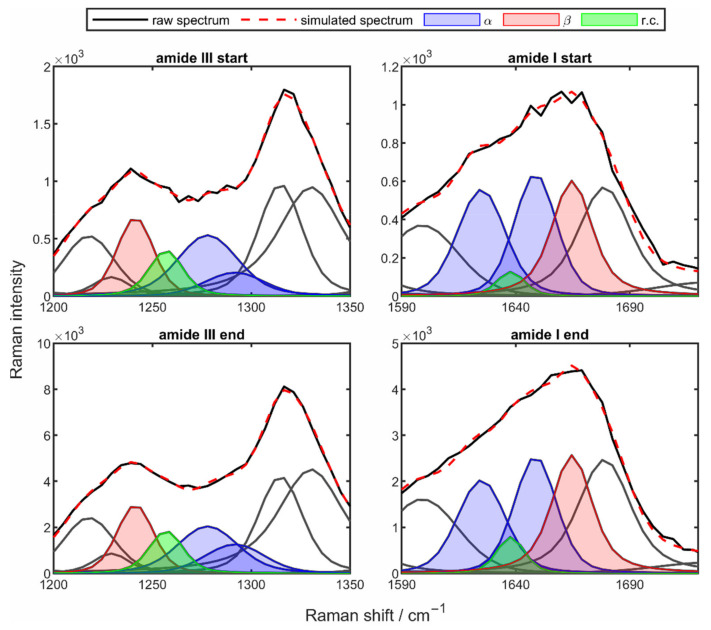
Figure 5.
Amide III region (left column) and amide I (right column) of the reconstructed spectrum from the drying process of a 10 wt% poly-L-lysine solution droplet at a drying temperature of 50 °C at the beginning (top row) and the end of the drying process (bottom row), with the different secondary structure elements color-coded.

