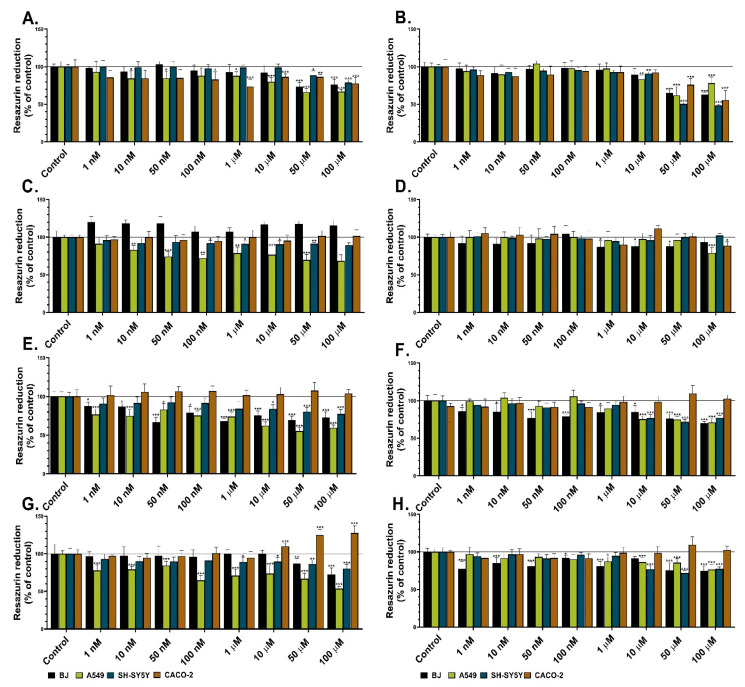
Figure 2.
Metabolic activity of BJ, A549, SH-SY5Y, and CACO-2 cell lines after 24 h (A,C,E,G) and 48 h treatments (B,D,F,H) with Les-3166 (A,B), Les-5935 (C,D), Les-6009 (E,F), and Les-6166 (G,H). Mean values (n = 6) with standard deviation (error bars) where *, **, and *** are statistically different from the respective (vehicle-treated) control at p < 0.05, p < 0.01, and p < 0.001, respectively (one-way ANOVA, Tukey’s test).

