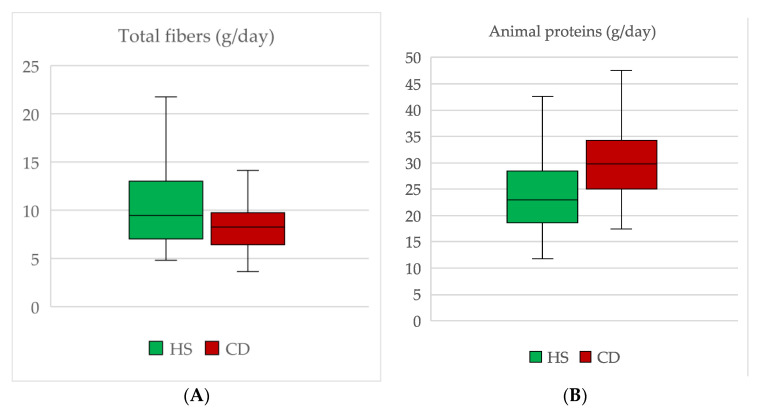
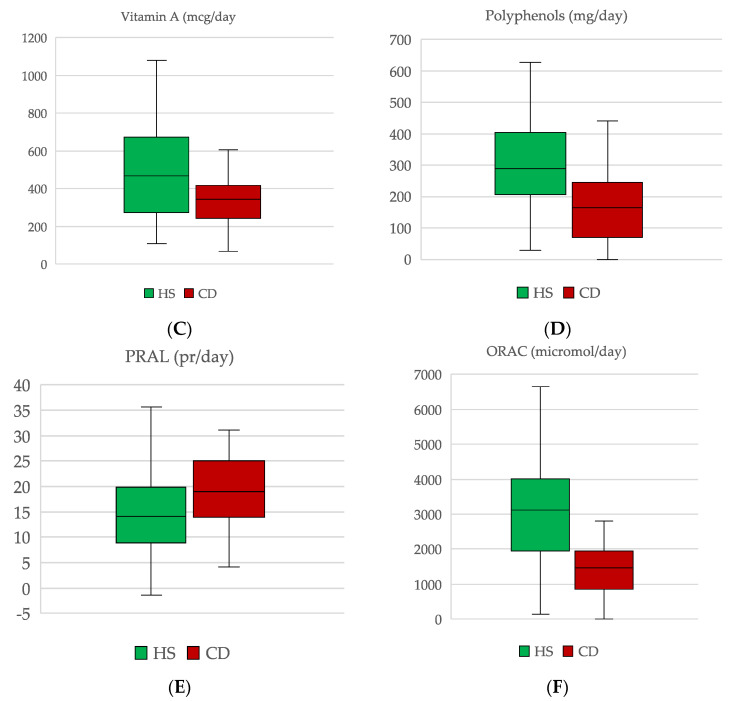
Figure 1.
Graphic representation of tbe most relevant statistically significant results. (A) Total fibers; (B) Animal proteins; (C) Vitamin A; (D) Polyphenols; (E) PRAL; (F) ORAC. Boxes represent IQR and horizontal middle lines are medians. Whiskers highlight minimum and maximum values. p-values are mentioned in the text. HS: Healthy subjects. CD: Crohn’s disease. ORAC: Oxygen Radical Absorbance Capacity. PRAL: Potential Renal Acid Load.


