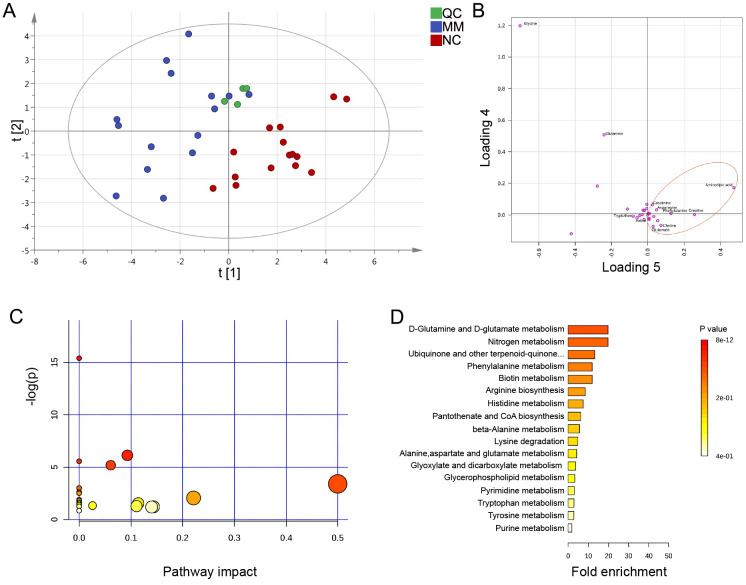
Figure 4. PLS-DA analysis based on MRM-MS data and functional pathway of key differential metabolites between MM and NC groups.
(A, B) PLS-DA scores and loading plots between MM patients and normal controls based on the MRM-MS data. (C, D) Metabolic pathway enrichment analysis of differential amino acids metabolites between MM patients and NC. In (C), each related metabolic pathway is shown as a circle, whose size and color are based on the pathway impact value and the P value, respectively.

