Figure 8.
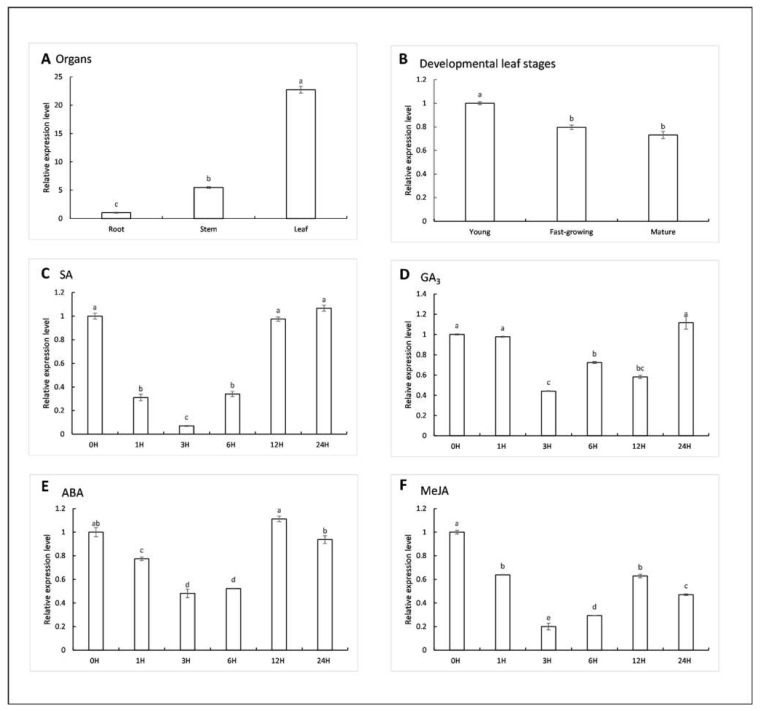
Expression profiles of ZjPSY. (A) ZjPSY expression pattern in root, stem, and leaf. (B) ZjPSY expression pattern in leaves at different developmental stages. (C–F) Expression pattern in leaf under 10 μM GA3 treatment (C), 10 μM ABA treatment (D), 0.5 mM SA treatment (E), and 10 μM MeJA treatment (F). Different letters above the columns indicate significant differences (p ≤ 0.05, n = 3). ZjPSY expression in root (A), young stage (B), and 0 h (C–F) was set as calibrator sample with a relative expression equal to 1.

