Figure 6.
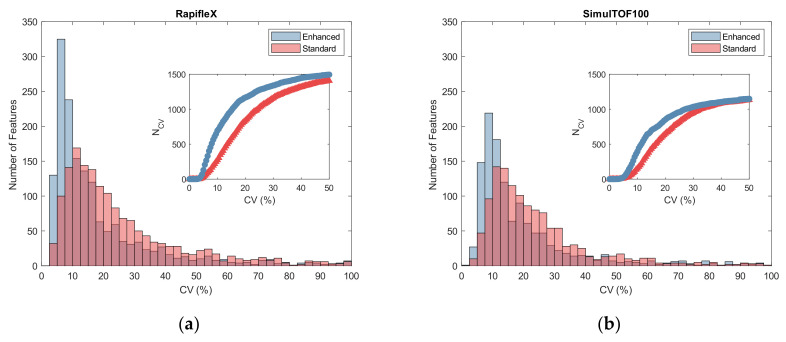
Reproducibility of feature values for a single sample over 20 preparations and acquisitions collected on the (a) RapifleX and (b) SimulTOF100. Histograms of CVs for standard (red) and enhanced (blue) feature values are shown in the main plot. The inset shows the cumulative CV distribution, , for the standard (red, triangles) and enhanced feature values (blue, circles) (only CVs up to 50% are shown for clarity).

