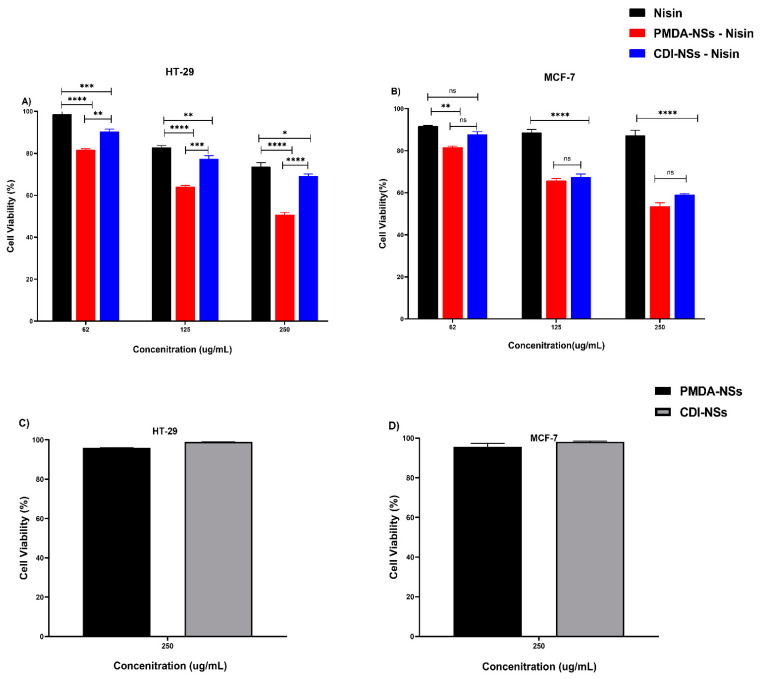
Figure 6.
Cell viability results for colon cancer (HT-29) and breast cancer (MCF-7) cells exposed to Nisin-Z and loaded on nanosponges (A,B) and plain nanosponges (C,D) for 24 h. Results are expressed relative to the untreated control, which was set as 100% viable. Data are expressed as mean ± SD (n = 3). Two-way ANOVA analyses was used. * p < 0.05, ** p < 0.01, *** p < 0.001, **** p < 0.0001, and ns (Not Significant).

