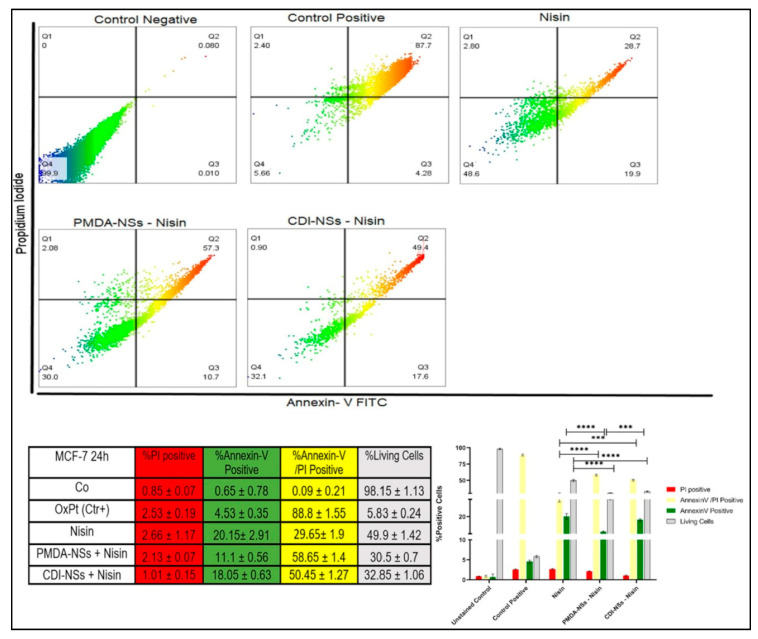
Figure 8.
Representative flow cytometric dot-plots indicating the population sizes of apoptotic and necrotic in MCF-7 cells after exposure to 250 µg/mL of Nisin Z and loaded on PMDA/CDI-NSs for 24 h. Analyses were performed with annexin-V-FITC (FITC) and propidium iodide (PI). The untreated control was not exposed to Nisin Z and the complexes, and positive control was treated with oxaliplatin (OxPt). Experiments were done in triplicate and independently repeated. Bar graphs illustrate the percentage of apoptotic, necrotic, and late-stage apoptotic MCF-7 cells after exposure to free Nisin Z and encapsulated by the NSs. *** p < 0.001, **** p < 0.0001 apoptosis relative to the free Nisin Z. Data are expressed as mean ± SD (n = 3). Two-way ANOVA analyses was used.

