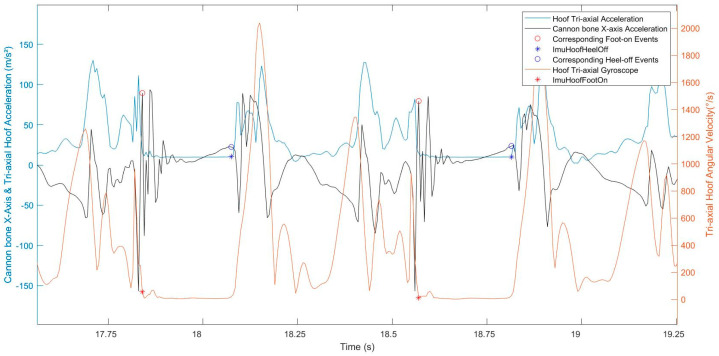
Figure 2.
Representation of the normalized signals (normalized by the maximum value) of the hoof tri-axial acceleration (blue curve), the hoof tri-axial gyroscope (red curve), and the cannon bone x-axis acceleration (black curve) of a horse trotting on straight line and hard ground. The red stars correspond to the reference foot-on and the blue stars correspond to the reference heel-off. The cannon bone x-axis acceleration at these same events also appear on the cannon bone curve (blue and red circles on the yellow curve).

